U.S. States by GDP Per Capita Growth (2000-2024)

See more visuals like this on the Voronoi app.
Use This Visualization
Ranked: U.S. States by GDP Per Capita Growth (2000-2024)
See more visuals like this on the Voronoi app.
Use This Visualization
Ranked: U.S. States by GDP Per Capita Growth (2000-2024)
Universities Where the Most Alumni Become Entrepreneurs
Key Takeaways
See more visualizations like this on the Voronoi app.
Use This Visualization
Mapped: The Most Religious States in America
See more visualizations like this on the Voronoi app.
Use This Visualization
Mapped: U.S. Incarceration Rates by State
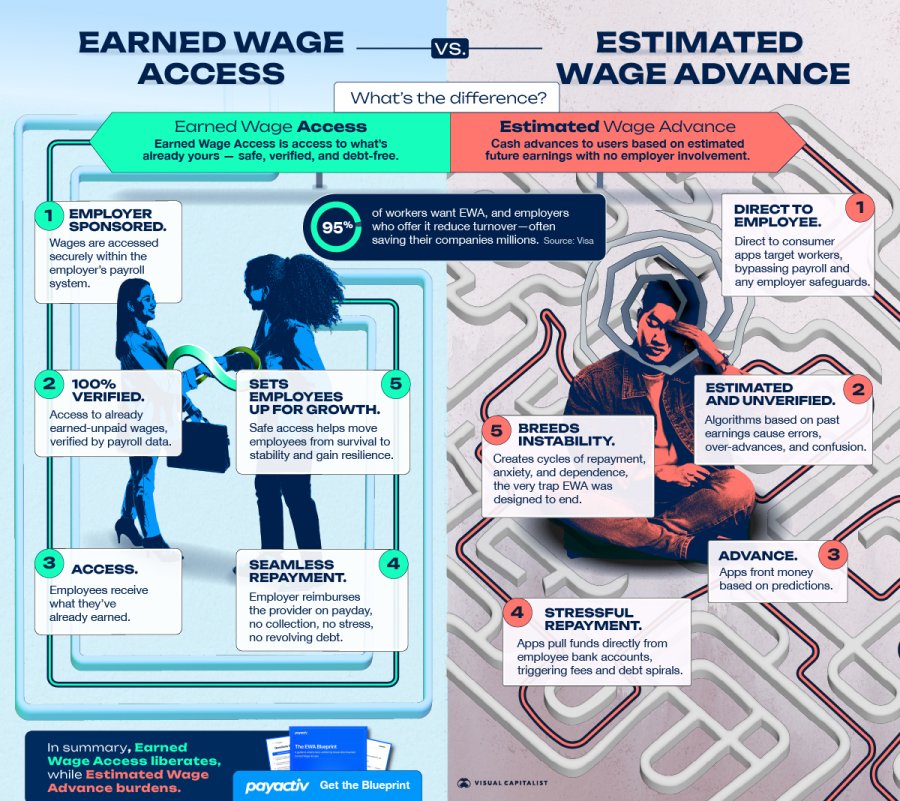
View the full-size version of this graphic
Explainer: What is Earned Wage Access and Why Do You Need it?
Key Takeaways