Visualizing America’s Wealth Distribution by Generation

See this visualization first on the Voronoi app.
See this visualization first on the Voronoi app.
See this visualization first on the Voronoi app.
Use This Visualization
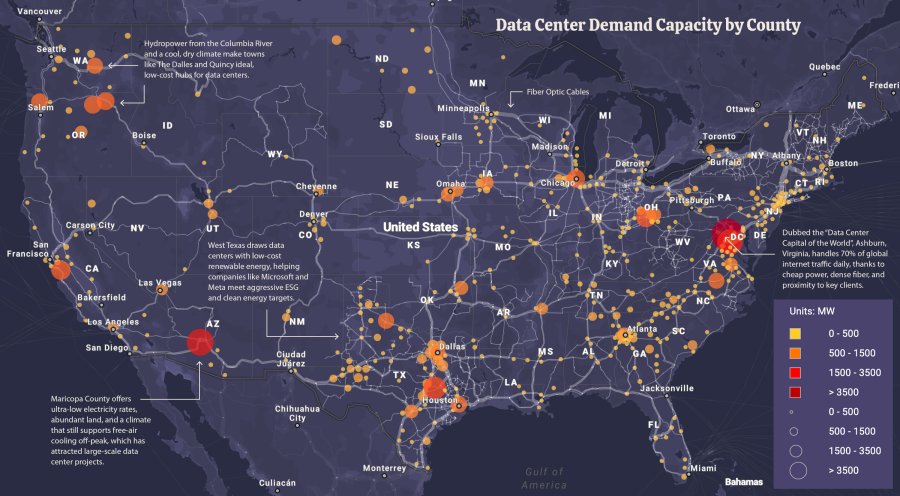
Mapped: The Massive Network Powering U.S. Data Centers
See this visualization first on the Voronoi app.
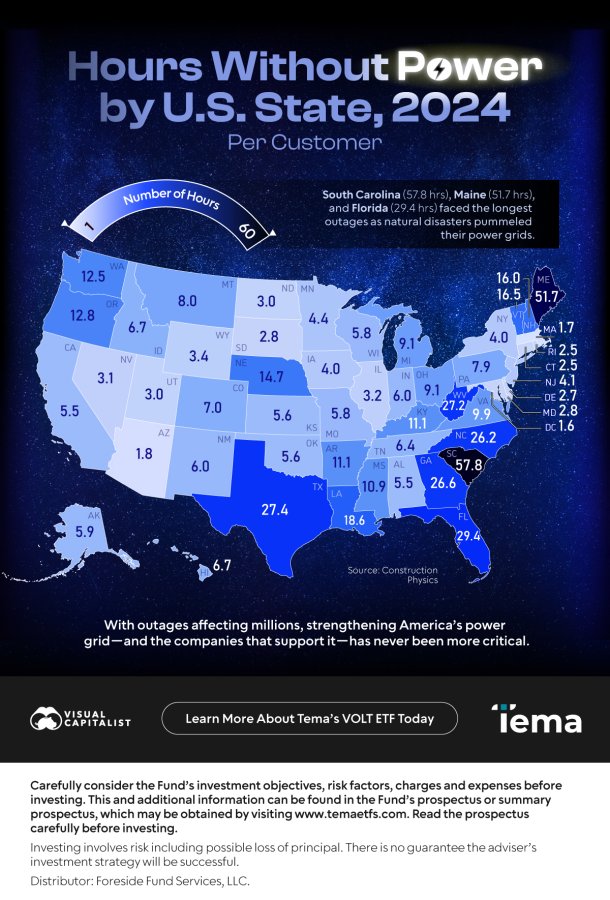
Blackout Map: Which States Lost the Most Power in 2024?
As America’s aging power grid continues to deteriorate, the risk of disruptions and blackouts is rising. But are these problems spread evenly across the country?