Visualizing Gold Production by Country

See this visualization first on the Voronoi app.
See this visualization first on the Voronoi app.
See this visualization first on the Voronoi app.
See this visualization first on the Voronoi app.
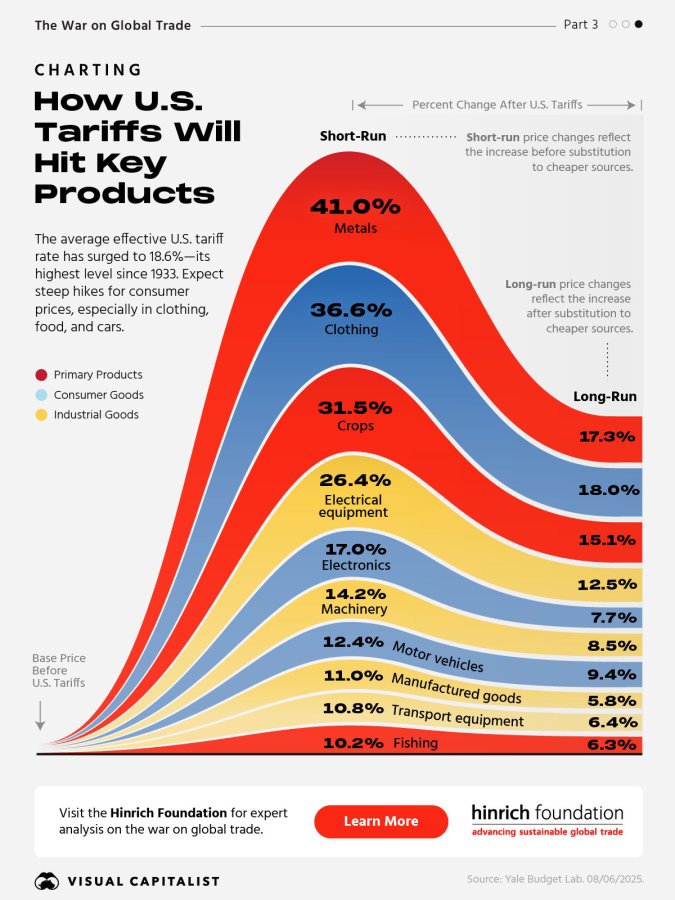
Charting How U.S. Tariffs Will Hit Key Products
U.S. tariffs have climbed to an average rate of 18.6%—the highest since 1933. But what does this mean for everyday consumers?
See this visualization first on the Voronoi app.