You are here

Business

This Is What A Broken Bond Market Looks Like: Treasury "Failures" Soars To Multi-Year Highs

This Is What A Broken Bond Market Looks Like: Treasury "Failures" Soars To Multi-Year Highs

Earlier this week, when looking at the rapidly fraying dynamics in the all-important Treasury repo market, we explained that as a result of the unprecedented, record shortage of underlying paper, the repo rate for the 10Y has plunged to the lowest on record (and even surpassing it on occasion), the -3.00% "fails" rate, an unstable, broken state characterized by a surge in failures to deliver and receive, when one party fails to deliver a U.S. Treasury to another party by the date previously agreed by the parties.

Why Despite Today's Market Surge, Bank of America Stubbornly Refuses To Join The Rally

Why Despite Today's Market Surge, Bank of America Stubbornly Refuses To Join The Rally

Yesterday, it was risk off, and the litany of complaints aimed at "Blooper Mario" and the ECB's disappointment was relentless; then after supposedly "reassessing" what the ECB really announced, we have shifted to a global risk on euphoria and this morning pundits can't find enough praise for "Super Mario."

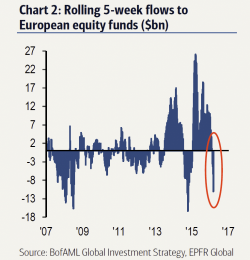
And yet one strategist refuses to flop to yesterday's flip: BofA's credit strategist Michael Hartnett, who has been urging to sell this rally for the past few weeks, and who continues to do so today. Here's why.

China Exports Most Deflation To US Since 2010

China Exports Most Deflation To US Since 2010

For the 18th month in a row, US Import prices fell YoY (down 6.1% vs expectations of a 6.5% drop). This is the longest deflationary streak since 1999. Under the hood we see the first first rise in prices (ex food, fuel) since May 2014. Fuel price dropped 3.9% - the 8th consecutive drop - and foreign food product prices dropped 2% - the most since Feb 2012.  Perhaps most crucially, China's forced deflationary wave continues to build with the index at its lowest since 2010.

Longest losing streak since 1999...

Pages