You are here

Business

Do Any Of The Current Rallies Pass "The Sniff Test"? (Spoiler Alert: No!)
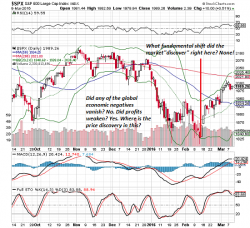
Do Any Of The Current Rallies Pass "The Sniff Test"? (Spoiler Alert: No!)

Submitted by Charles Hugh-Smith of OfTwoMinds blog,

But you can't tame the monster of speculative, legalized looting and financialization.

Everything from iron ore to copper to the Baltic Dry Index to stocks to bat guano is rallying. The problem is not a single rally passes "the sniff test:" is the rally the result of changing fundamentals, or is it merely short-covering and/or speculative hot money leaping from one rally to the next?
The ECB's Embarrassing Inflation Forecast Implodes

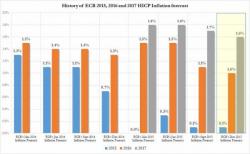
The ECB's Embarrassing Inflation Forecast Implodes

Three months ago, when the ECB released its latest quarterly inflation expectations, we mocked that "there is a bit of a hockeystick" going from 2015 to 2016, when HICP inflation was expected to soar from 0.1% to 1.0%.

We said the following:

"in March 2014, the ECB predicted 2016 year end inflation would be 1.5%. It now predicts it will rise to 1.0%, decidedly lower than the 1.5% predicted in June, and yet in our humble opinion, still about 1% higher than where it will end up."

Visually:


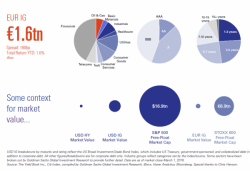
This Is The $1 Trillion In European IG Bonds Which The ECB Is Now Buying

This Is The $1 Trillion In European IG Bonds Which The ECB Is Now Buying

Ever since the start of ECB's QE, one of the biggest concerns has been how will the ECB continue monetizing €60 billion in debt in a market that is increasingly illiquid and running out of collateral. Moments ago we got the answer when the ECB not only went even deeper into negative rates territory, cutting all three of its main rates, but boosted QE by €20BN.

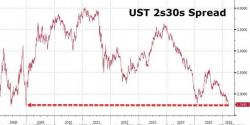
US Treasury Curve Collapses To Dec 2008 Lows

US Treasury Curve Collapses To Dec 2008 Lows

The spread between the 30Y US Treasury yield and 2Y has plunged by 7.5bps this morning (as 2Y sells off and 30Y rallies post-Draghi) to 175bps. This is the flattest curve since Dec 2008 lows (at 172bps) which can only bode poorly for financials...

30Y bonds are bid (juicy yield compared to Europe) and 2Y yields are surging (room for a Fed rate hike)...


Still buying the Dimon Bottom?


Charts: Bloomberg

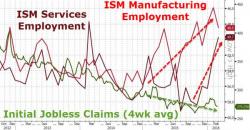
Jobless Claims Joke Chart Of The Day

Jobless Claims Joke Chart Of The Day

Initial jobless claims tumbles to 259k (from a revised 277k) near 43 year lows, leaving the smoother 4-week average lower at 267.5k. What we find "odd" about this seasonally-adjusted data is that the employment components of both the Manufacturing and Services ISM data has completely collapsed in the last few months. So what sector of the economy is maintaining the illusion?

Not The Onion...


Not even China tries this level of shenanigans.


Charts: Bloomberg

Pages