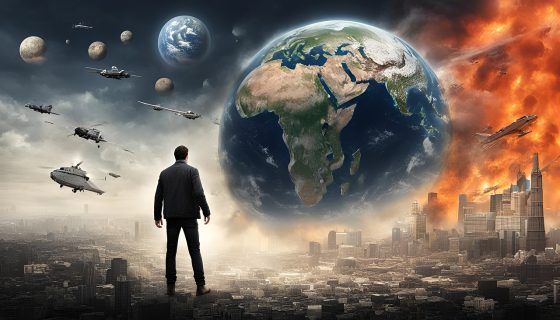
Signs Of The Times: War, Famine, Pestilences And Natural Disasters
![]()
See this visualization first on the Voronoi app.

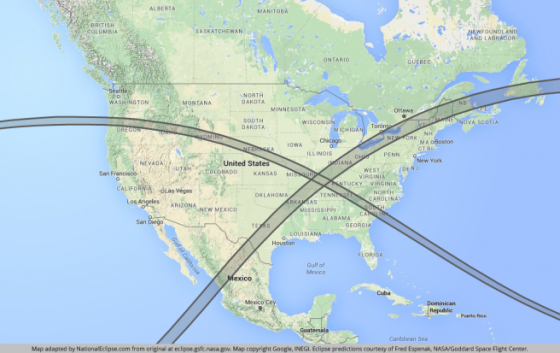
The Largest Earthquakes in the New York Area
This was originally posted on our Voronoi app. Download the app for free on Apple or Android and discover incredible data-driven charts from a variety of trusted sources.
![]()
See this visualization first on the Voronoi app.
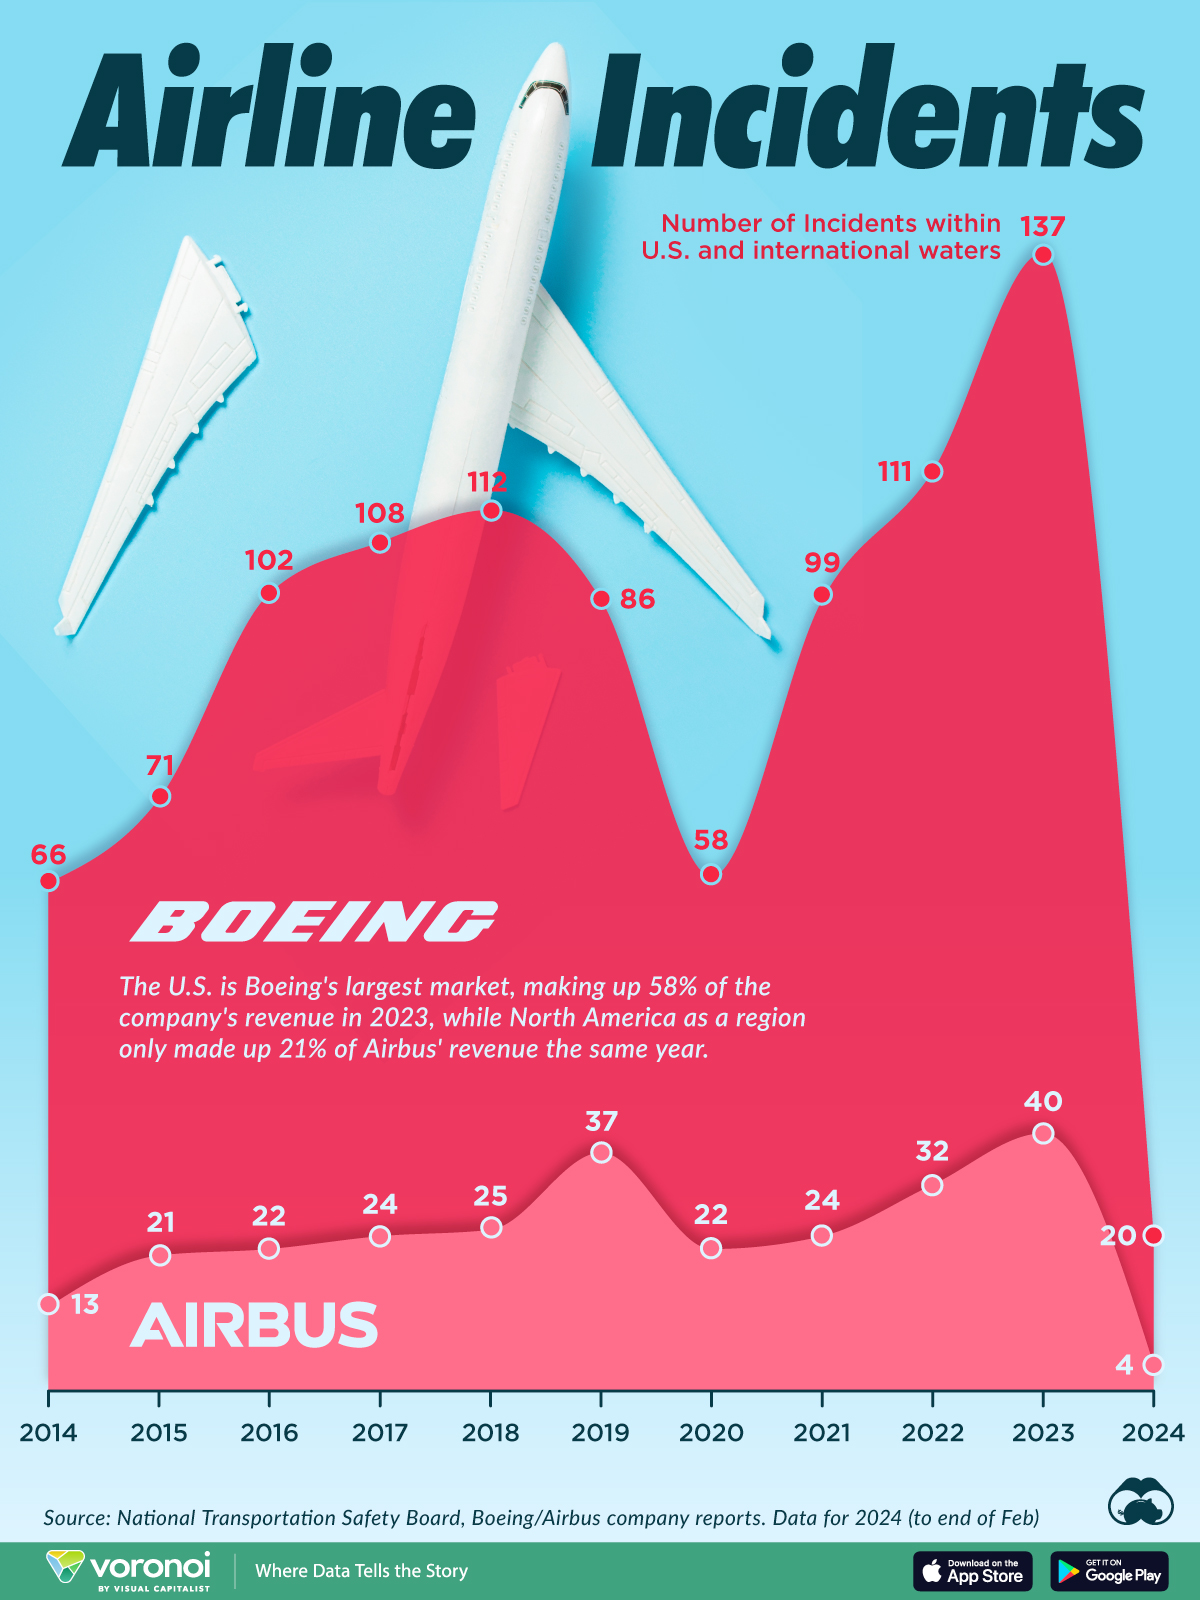
Airline Incidents: How Do Boeing and Airbus Compare?
This was originally posted on our Voronoi app. Download the app for free on iOS or Android and discover incredible data-driven charts from a variety of trusted sources.