Visualizing the Top 10 Global Risks (2020-2025)

See more visualizations like this on the Voronoi app.
Use This Visualization
Visualizing the Top 10 Global Risks (2020-2025)
See more visualizations like this on the Voronoi app.
Use This Visualization
Visualizing the Top 10 Global Risks (2020-2025)
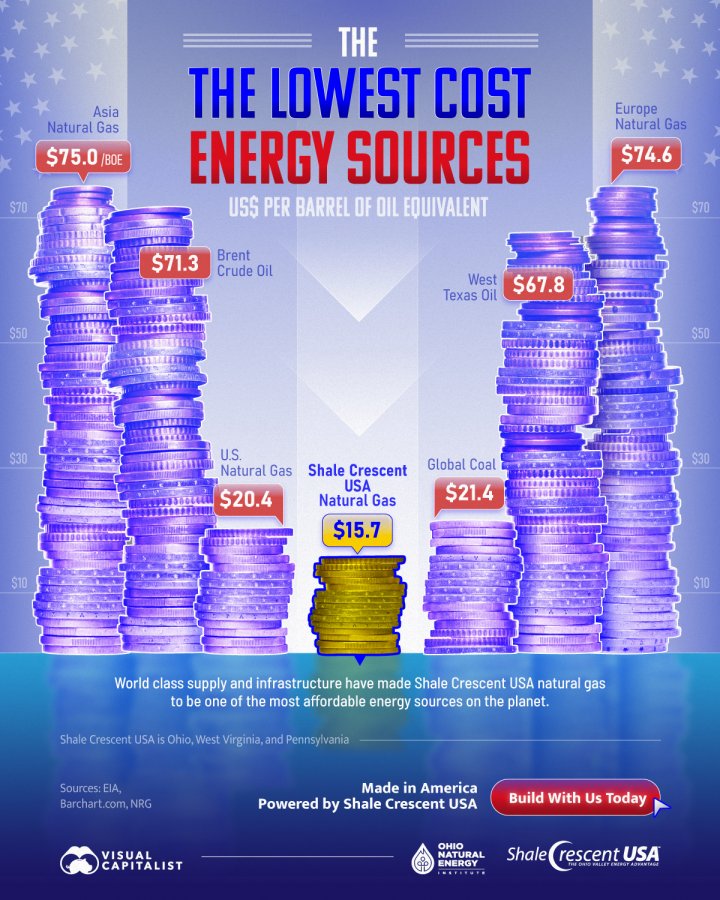
Ranked: The Lowest Cost Energy Sources
Key Takeaways
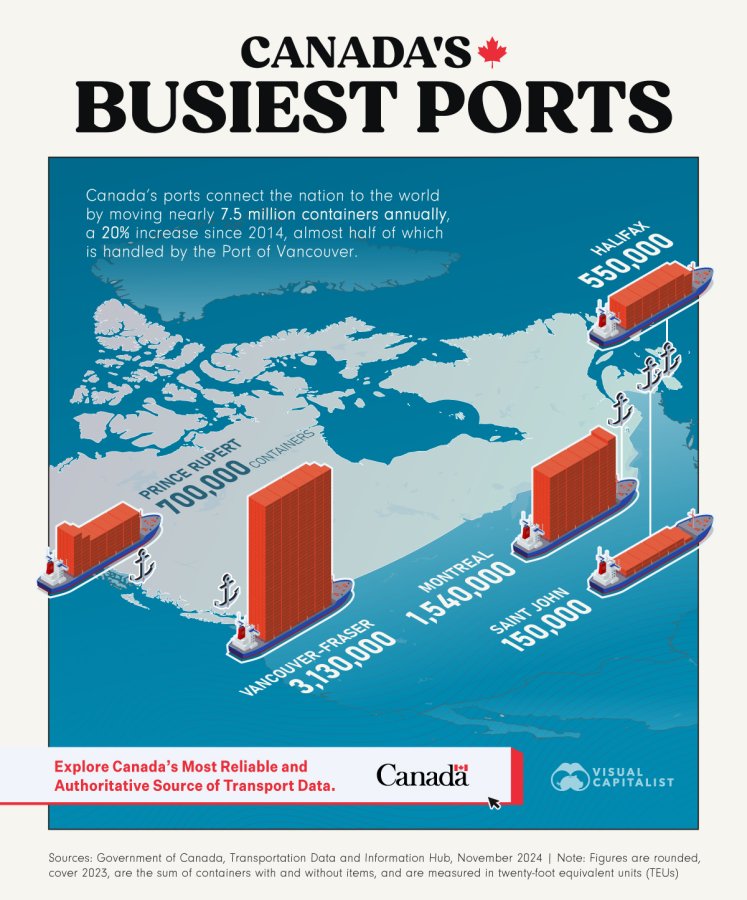
Mapped: Canada’s Busiest Ports
Key Takeaways
See more visualizations like this on the Voronoi app.
Use This Visualization
Mapped: The Number of People in Poverty in U.S. Cities
See this visualization first on the Voronoi app.
Use This Visualization
How Europe’s Cities Have Grown Since 1975
This was originally posted on our Voronoi app. Download the app for free on iOS or Android and discover incredible data-driven charts from a variety of trusted sources.