Stocks Give Up "Volumeless, No Good Reason" Gains On Hawkish FedSpeak
It's over...Hotflation and Fedspeak - unless the S&P plunged 200 points, June is on like Donkey Kong.
Who could have seen that coming...
It's over...Hotflation and Fedspeak - unless the S&P plunged 200 points, June is on like Donkey Kong.
Who could have seen that coming...

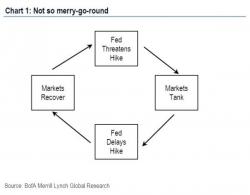
Today's steep selloff was launched by the latest jawboning by Lockhart and Williams who, now that the S&P 500 is back comfortably above 2000, once again hinted that a June rate hike is back on the table. Incidentally, the dynamic of the Fed responding to the market, and the market responding to the Fed, has been the only one worth paying attention to in recent months.
Confused? Don't be. Here is an explanation from none other than Bank of America.

What happens if - just as it did in Aug 2015 and Jan 2016 - the S&P 500 starts caring about Chinese stocks? The answer, as BofAML's Stephen Suttmeier explains, is "nothing good."

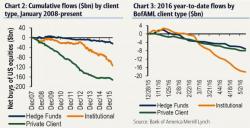
Last night, following 15 consecutive weeks of client selling, we asked - rhetorically - if today the selling by BofA's smart money clients would stretch to a new record 16 consecutive weeks.
Will it be a record 16 consecutive weeks of smart money outflows? Find out tomorrow
— zerohedge (@zerohedge) May 17, 2016
Earlier today we received the BofA update, as well as the answer: a resounding yes.
Here is BofA:

It has been more of the same overnight, as global stocks piggybacked on the strong US close and rose despite the lack of good (or bad) macro news, propelled higher by the two usual suspects: a higher USDJPY and a even higher oil, if mostly early on in the trading session.
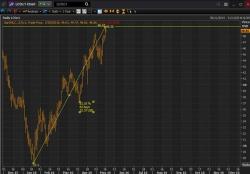
Yes, the oil squeeze higher continues, and as the charts below courtesy of Andy Critchlow show, Brent is now 82% higher in the past 82 days...
... while crude has had its strongest rally since 2010.