Thanks To The Rapidly Imploding U.S. Economy, Joe Biden’s Poll Numbers Have Plunged To Unprecedented Levels

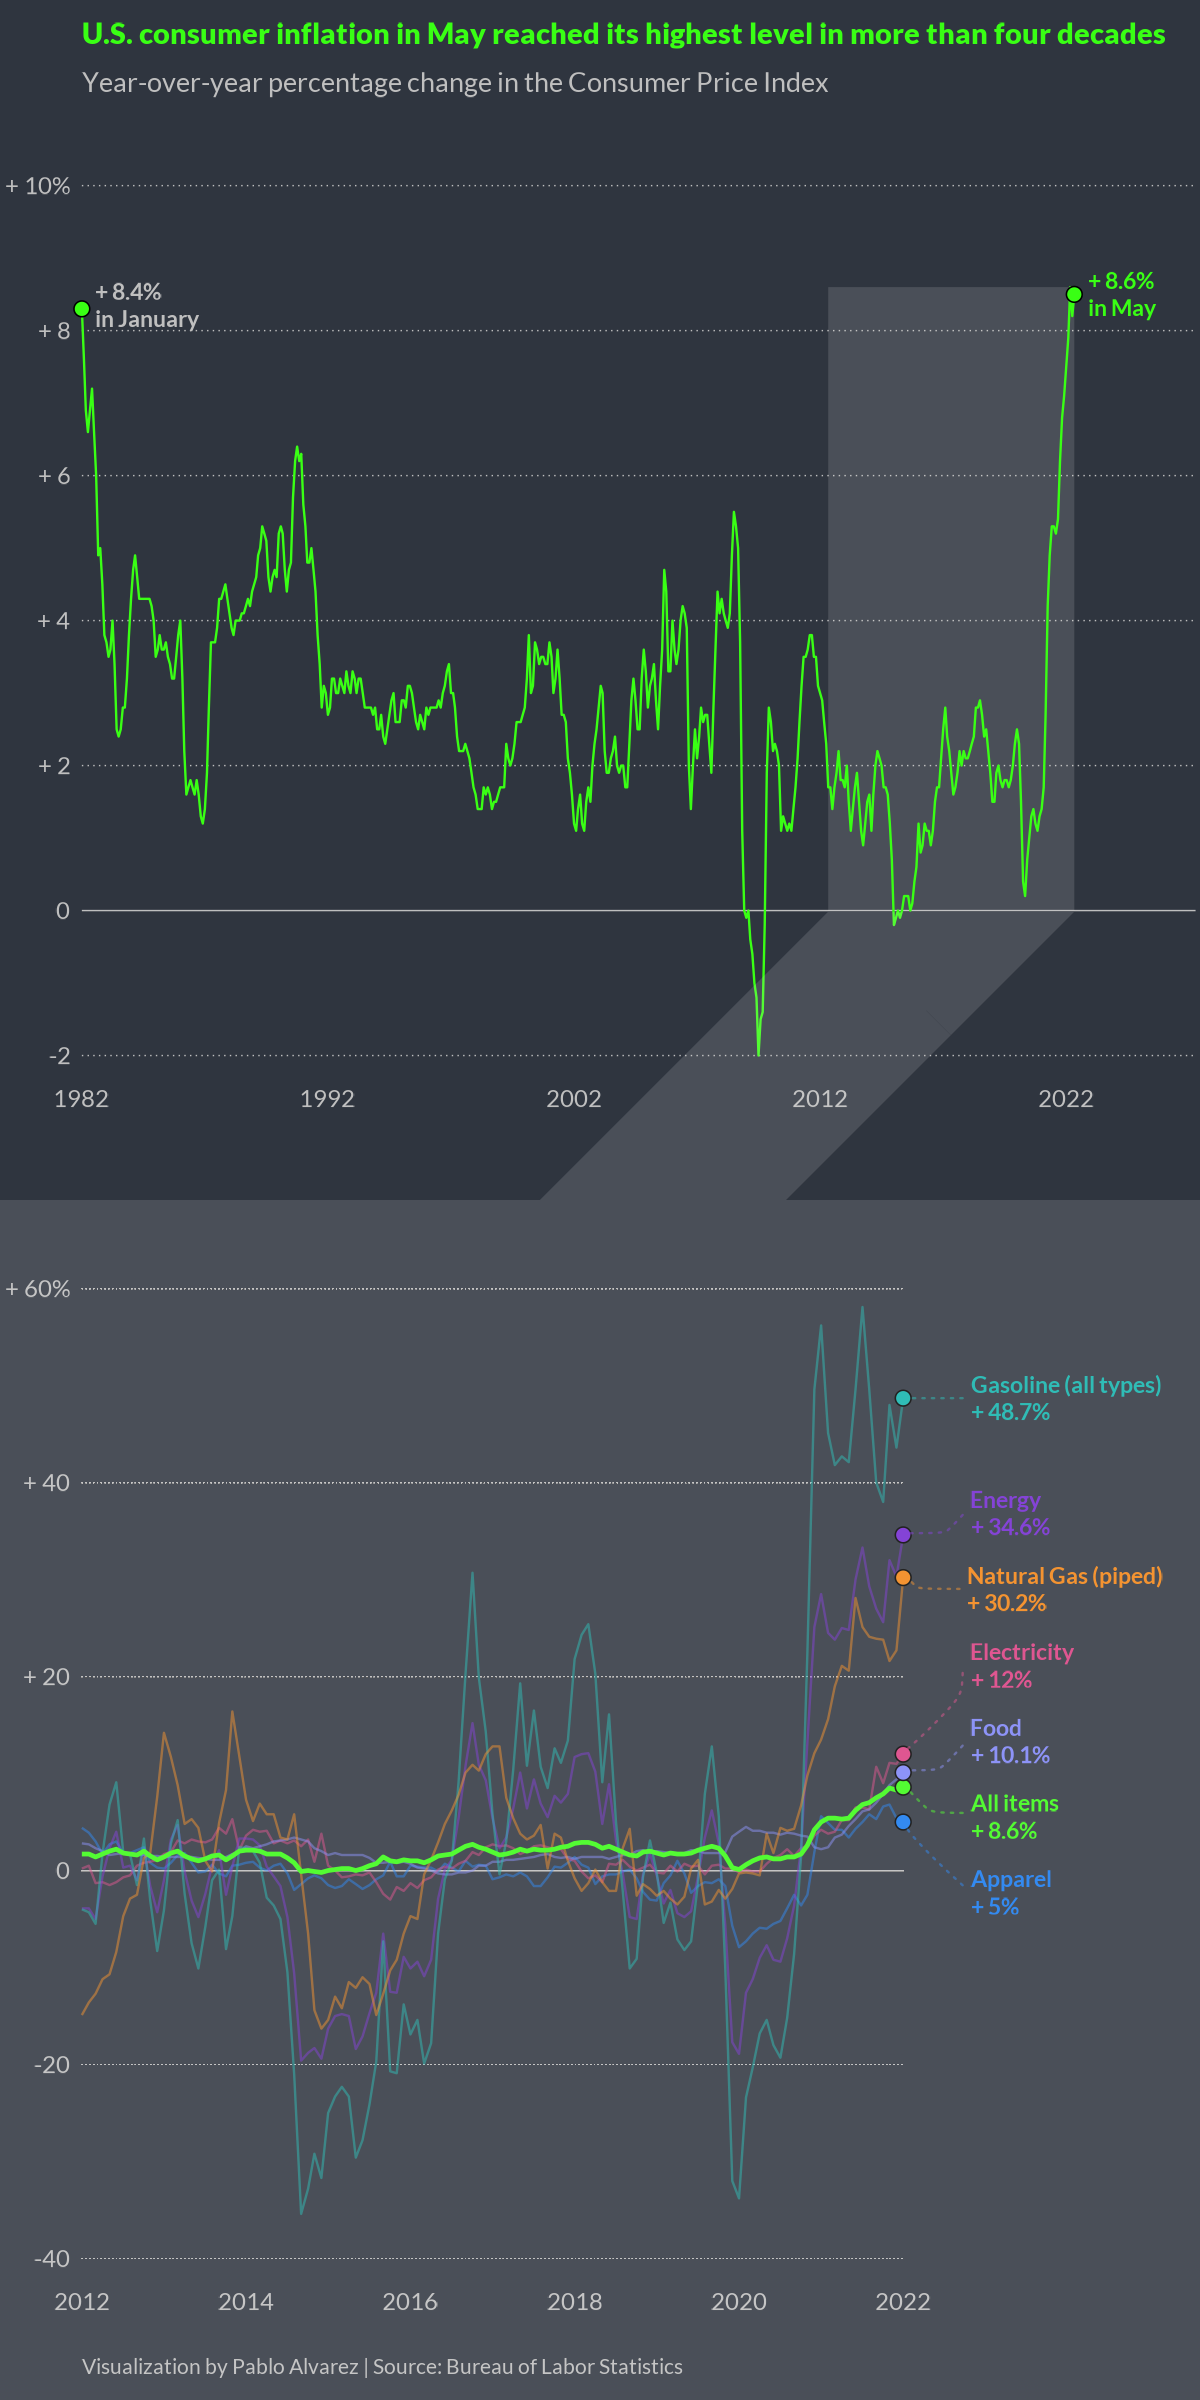
Charted: Four Decades of U.S. Inflation
In May 2022, the annual rate of U.S. inflation grew to 8.6%—the highest it’s been in four decades, according to the Bureau of Labor Statistics.
What’s driving this surge, and what products are seeing the most significant price jumps?
This visualization by Pablo Alvarez shows U.S. inflation levels since 1982 and highlights a few product categories that have seen the biggest year-over-year increases.


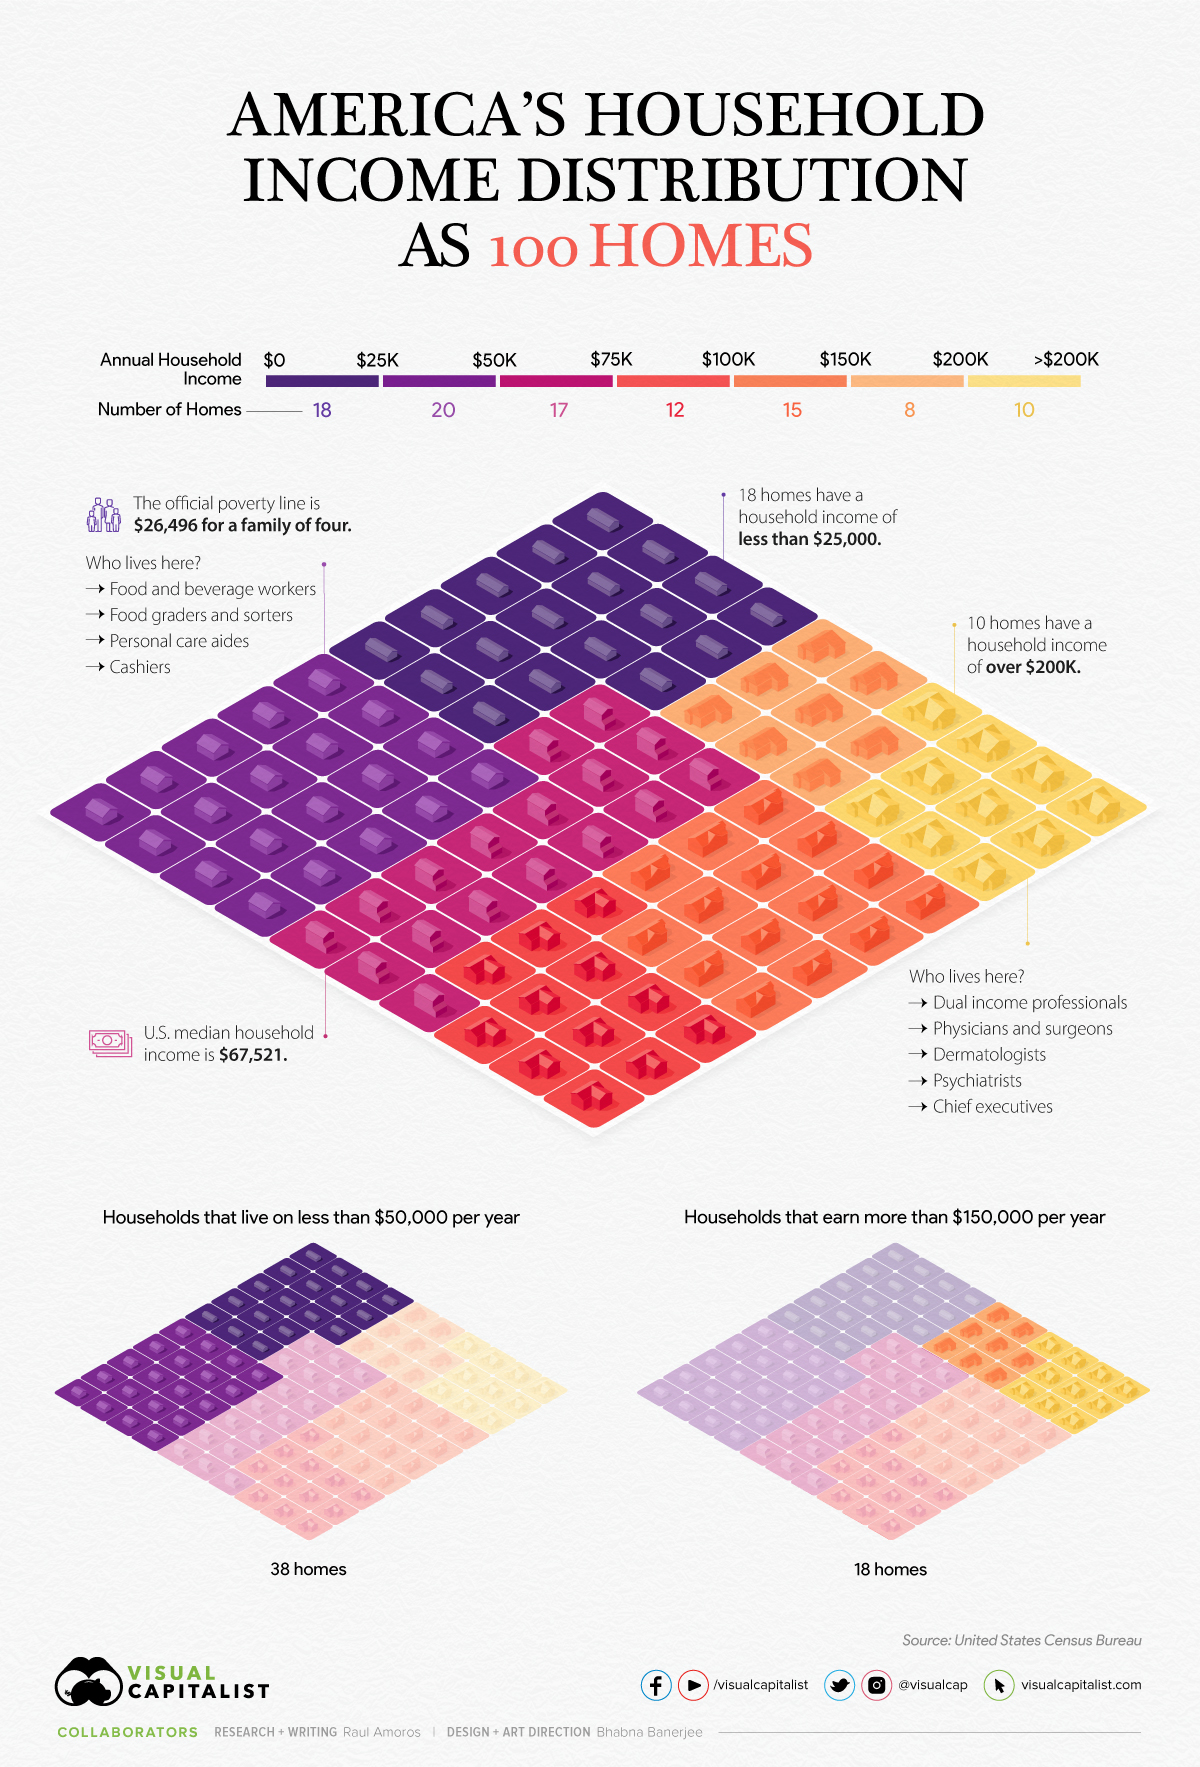
Household Income Distribution in the U.S. Visualized as 100 Homes
Income inequality and wealth disparity have been frequent topics of conversation, even before the pandemic upended the economy.
Now, rising inflation and interest rates, and a possible recession on the horizon are bringing these societal divides into sharp focus.