![]()
See more visuals like this on the Voronoi app.
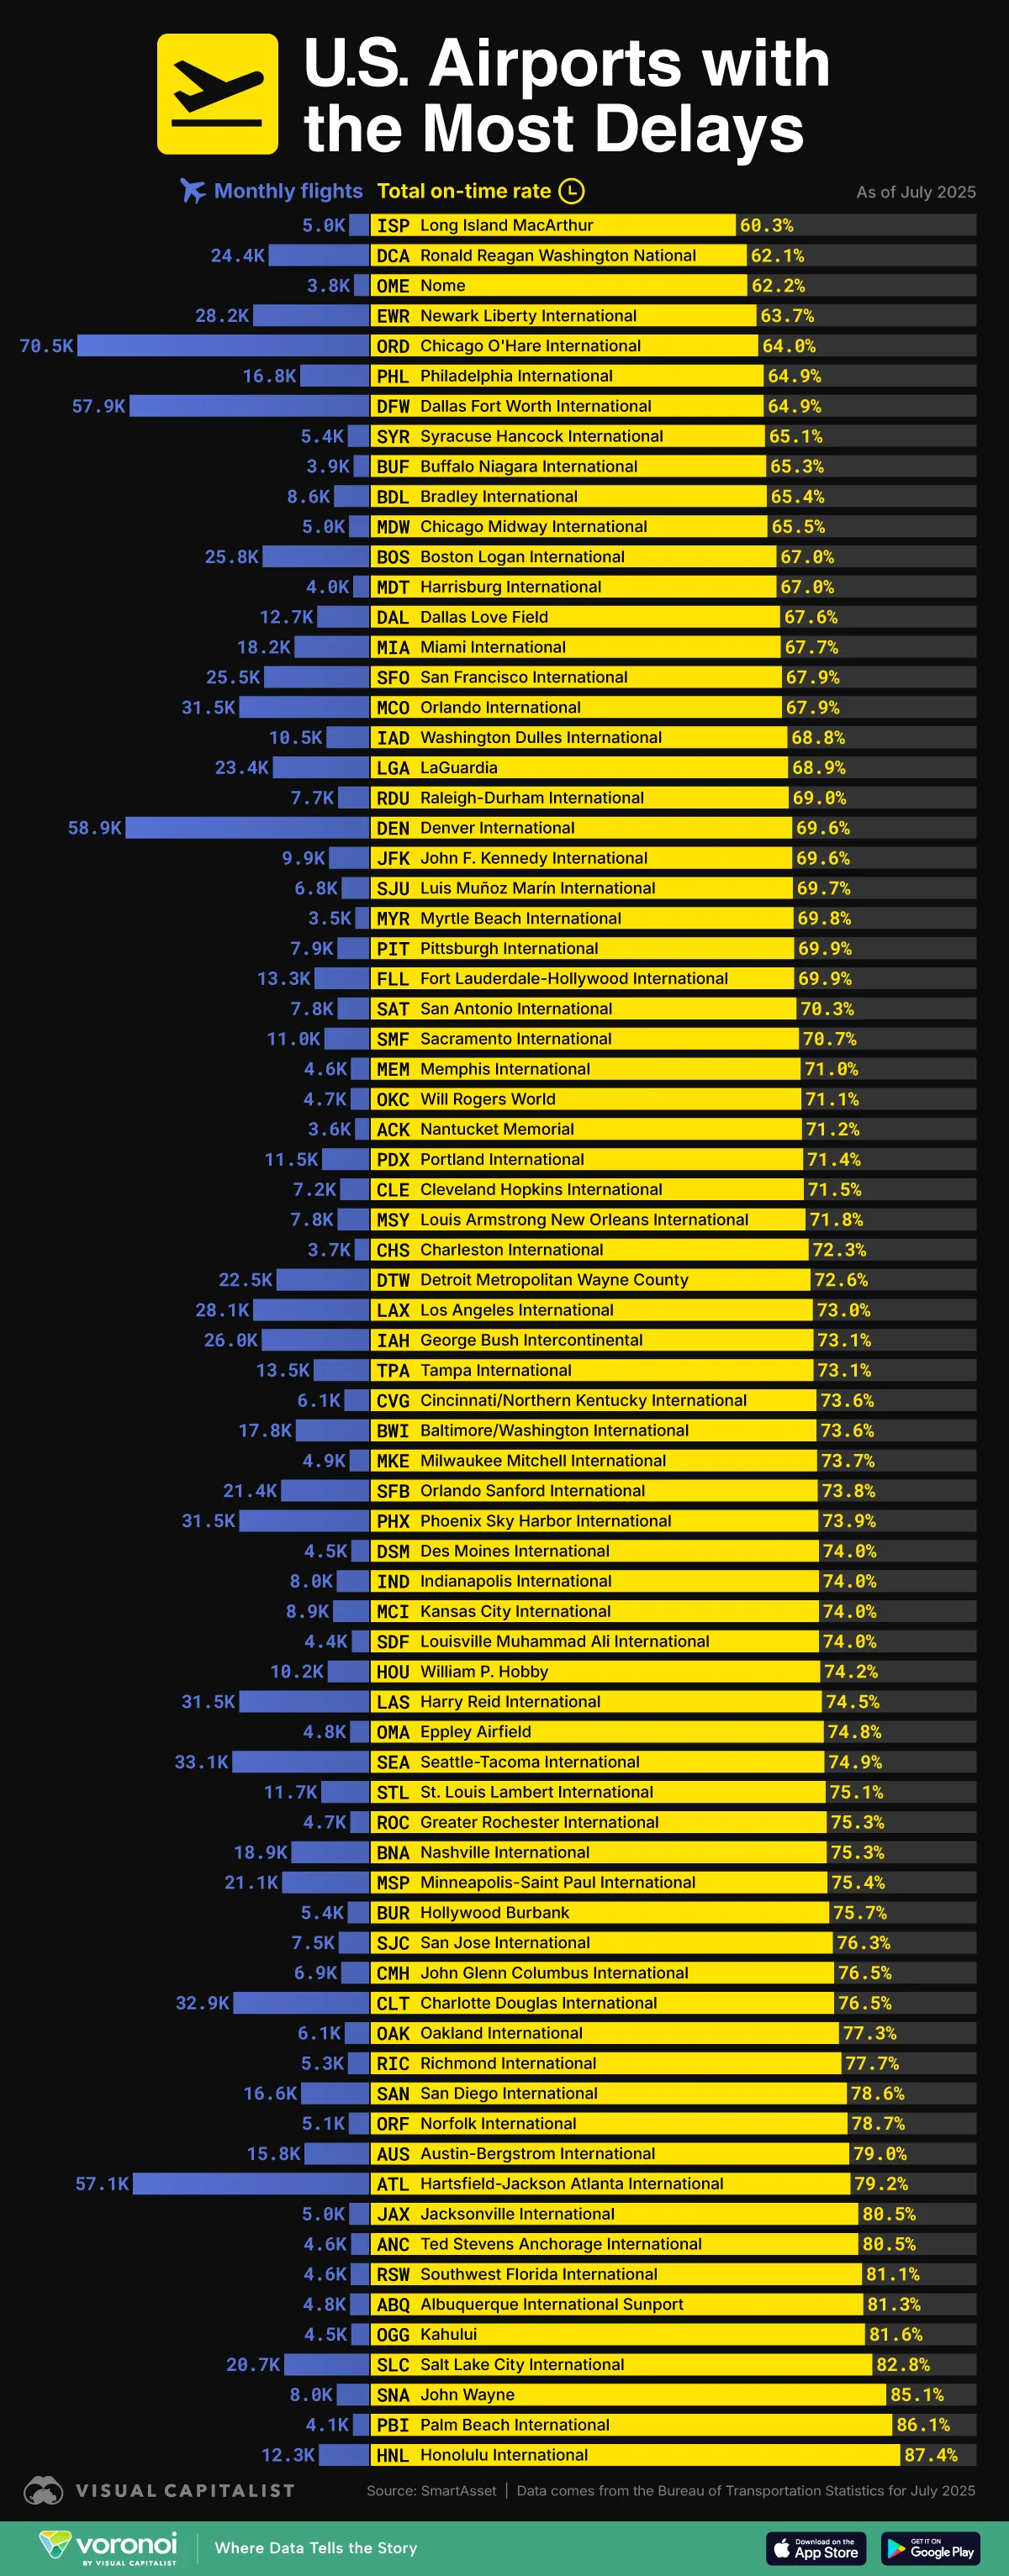
All Major U.S. Airports Ranked by Number of Flight Delays
See visuals like this from many other data creators on our Voronoi app. Download it for free on iOS or Android and discover incredible data-driven charts from a variety of trusted sources.
Key Takeaways
- Major U.S. hubs like Chicago O’Hare, Dallas–Fort Worth, and Newark have some of the nation’s lowest on-time rates due to congestion and weather.
- Southern and coastal airports benefit from milder climates, helping Honolulu, Palm Beach, and San Diego rank among the most punctual in 2025.
Flight delays remain a persistent challenge across the United States. This data set shows how geography, weather patterns, and high traffic volumes shape punctuality across the national air network.
Large, high-traffic airports consistently rank lower, reflecting the strain of urban airspace, complex operations, and seasonal weather patterns. Meanwhile, airports in warmer regions, particularly in the South and along the coasts, tend to experience fewer disruptions.
The data for this visualization comes from SmartAsset and covers 75 of the largest airports in the United States.
Major Hubs Face Persistent Congestion Challenges
Long Island MacArthur Airport (ISP) ranks number one for the lowest on-time performance in the 2025 dataset, with just 60.3% of flights arriving as scheduled. Despite being a smaller regional airport, ISP faces several operational constraints that can amplify delays, including limited runway capacity, seasonal weather challenges on Long Island, and its proximity to the congested New York airspace.
| Airport | City | Total on-time rate | Monthly flights |
|---|---|---|---|
| Long Island MacArthur Airport (ISP) | Islip | 60.3% | 4,994 |
| Ronald Reagan Washington National Airport (DCA) | Washington, D.C. | 62.1% | 24,386 |
| Nome Airport (OME) | Nome | 62.2% | 3,835 |
| Newark Liberty International Airport (EWR) | Newark | 63.7% | 28,156 |
| Chicago O'Hare International Airport (ORD) | Chicago | 64.0% | 70,457 |
| Philadelphia International Airport (PHL) | Philadelphia | 64.9% | 16,794 |
| Dallas Fort Worth International Airport (DFW) | Dallas–Fort Worth | 64.9% | 57,920 |
| Syracuse Hancock International Airport (SYR) | Syracuse | 65.1% | 5,365 |
| Buffalo Niagara International Airport (BUF) | Buffalo | 65.3% | 3,926 |
| Bradley International Airport (BDL) | Hartford | 65.4% | 8,626 |
| Chicago Midway International Airport (MDW) | Chicago | 65.5% | 5,032 |
| Boston Logan International Airport (BOS) | Boston | 67.0% | 25,833 |
| Harrisburg International Airport (MDT) | Harrisburg | 67.0% | 4,024 |
| Dallas Love Field Airport (DAL) | Dallas | 67.6% | 12,698 |
| Miami International Airport (MIA) | Miami | 67.7% | 18,154 |
| San Francisco International Airport (SFO) | San Francisco | 67.9% | 25,508 |
| Orlando International Airport (MCO) | Orlando | 67.9% | 31,475 |
| Washington Dulles International Airport (IAD) | Dulles / Washington, D.C. | 68.8% | 10,492 |
| LaGuardia Airport (LGA) | New York | 68.9% | 23,398 |
| Raleigh-Durham International Airport (RDU) | Raleigh–Durham | 69.0% | 7,709 |
| Denver International Airport (DEN) | Denver | 69.6% | 58,866 |
| John F. Kennedy International Airport (JFK) | New York | 69.6% | 9,852 |
| Luis Muñoz Marín International Airport (SJU) | San Juan | 69.7% | 6,831 |
| Myrtle Beach International Airport (MYR) | Myrtle Beach | 69.8% | 3,533 |
| Pittsburgh International Airport (PIT) | Pittsburgh | 69.9% | 7,854 |
| Fort Lauderdale-Hollywood International Airport (FLL) | Fort Lauderdale | 69.9% | 13,338 |
| San Antonio International Airport (SAT) | San Antonio | 70.3% | 7,796 |
| Sacramento International Airport (SMF) | Sacramento | 70.7% | 10,991 |
| Memphis International Airport (MEM) | Memphis | 71.0% | 4,578 |
| Will Rogers World Airport (OKC) | Oklahoma City | 71.1% | 4,664 |
| Nantucket Memorial Airport (ACK) | Nantucket | 71.2% | 3,592 |
| Portland International Airport (PDX) | Portland | 71.4% | 11,524 |
| Cleveland Hopkins International Airport (CLE) | Cleveland | 71.5% | 7,160 |
| Louis Armstrong New Orleans International Airport (MSY) | New Orleans | 71.8% | 7,804 |
| Charleston International Airport (CHS) | Charleston | 72.3% | 3,685 |
| Detroit Metropolitan Wayne County Airport (DTW) | Detroit | 72.6% | 22,496 |
| Los Angeles International Airport (LAX) | Los Angeles | 73.0% | 28,116 |
| George Bush Intercontinental Airport (IAH) | Houston | 73.1% | 26,035 |
| Tampa International Airport (TPA) | Tampa | 73.1% | 13,544 |
| Cincinnati/Northern Kentucky International Airport (CVG) | Cincinnati | 73.6% | 6,147 |
| Baltimore/Washington International Thurgood Marshall Airport (BWI) | Baltimore | 73.6% | 17,845 |
| Milwaukee Mitchell International Airport (MKE) | Milwaukee | 73.7% | 4,904 |
| Orlando Sanford International Airport (SFB) | Sanford / Orlando | 73.8% | 21,407 |
| Phoenix Sky Harbor International Airport (PHX) | Phoenix | 73.9% | 31,457 |
| Des Moines International Airport (DSM) | Des Moines | 74.0% | 4,492 |
| Indianapolis International Airport (IND) | Indianapolis | 74.0% | 7,996 |
| Kansas City International Airport (MCI) | Kansas City | 74.0% | 8,883 |
| Louisville Muhammad Ali International Airport (SDF) | Louisville | 74.0% | 4,352 |
| William P. Hobby Airport (HOU) | Houston | 74.2% | 10,186 |
| Harry Reid International Airport (LAS) | Las Vegas | 74.5% | 31,491 |
| Eppley Airfield (OMA) | Omaha | 74.8% | 4,788 |
| Seattle-Tacoma International Airport (SEA) | Seattle–Tacoma | 74.9% | 33,141 |
| St. Louis Lambert International Airport (STL) | St. Louis | 75.1% | 11,711 |
| Greater Rochester International Airport (ROC) | Rochester | 75.3% | 4,738 |
| Nashville International Airport (BNA) | Nashville | 75.3% | 18,917 |
| Minneapolis-Saint Paul International Airport (MSP) | Minneapolis–St. Paul | 75.4% | 21,129 |
| Hollywood Burbank Airport (BUR) | Burbank | 75.7% | 5,363 |
| San Jose International Airport (SJC) | San Jose | 76.3% | 7,527 |
| John Glenn Columbus International Airport (CMH) | Columbus | 76.5% | 6,908 |
| Charlotte Douglas International Airport (CLT) | Charlotte | 76.5% | 32,894 |
| Oakland International Airport (OAK) | Oakland | 77.3% | 6,073 |
| Richmond International Airport (RIC) | Richmond | 77.7% | 5,312 |
| San Diego International Airport (SAN) | San Diego | 78.6% | 16,592 |
| Norfolk International Airport (ORF) | Norfolk | 78.7% | 5,108 |
| Austin-Bergstrom International Airport (AUS) | Austin | 79.0% | 15,793 |
| Hartsfield-Jackson Atlanta International Airport (ATL) | Atlanta | 79.2% | 57,099 |
| Jacksonville International Airport (JAX) | Jacksonville | 80.5% | 4,995 |
| Ted Stevens Anchorage International Airport (ANC) | Anchorage | 80.5% | 4,569 |
| Southwest Florida International Airport (RSW) | Fort Myers | 81.1% | 4,630 |
| Albuquerque International Sunport (ABQ) | Albuquerque | 81.3% | 4,788 |
| Kahului Airport (OGG) | Kahului | 81.6% | 4,507 |
| Salt Lake City International Airport (SLC) | Salt Lake City | 82.8% | 20,661 |
| John Wayne Airport (SNA) | Santa Ana | 85.1% | 8,003 |
| Palm Beach International Airport (PBI) | West Palm Beach | 86.1% | 4,112 |
| Honolulu International Airport (HNL) | Honolulu | 87.4% | 12,309 |
The worst-performing major airports include Chicago O’Hare (64.0% on-time rate), Dallas–Fort Worth (64.9%), and Newark (63.7%). These airports manage some of the highest monthly flight volumes in the country, which increases the likelihood of bottlenecks during peak travel periods.
Cold-Weather Airports See Greater Seasonal Variability
Airports in the Northeast and Midwest tend to experience lower on-time rates due to winter storms, low visibility, and seasonal operational slowdowns.
Boston Logan (67.0%), Buffalo (65.3%), and Syracuse (65.1%) are notable examples.
Southern and Coastal Airports Lead in Punctuality
At the opposite end of the spectrum, warmer-weather airports such as Honolulu (87.4%), Palm Beach (86.1%), and San Diego (78.6%) show some of the highest on-time rates.
These regions benefit from fewer seasonal disruptions, consistent temperatures, and more predictable operational conditions.
Learn More on the Voronoi App ![]()
If you enjoyed today’s post, check out What Do Americans Find Unacceptable on Airplanes? on Voronoi, the new app from Visual Capitalist.