Just over a year ago, we launched Voronoi, our free new data discovery app.
Believe it or not, there are already more data-driven visuals on Voronoi than on Visual Capitalist (which has been around for 13 years!).
Every day there’s something new on Voronoi to see. And in aggregate, there are roughly 5,000 data stories to explore on the platform from 165+ world-class creators.
Explore Voronoi
Let’s see what captivated users in July.
We’ll take a look at some of the best Voronoi visuals over the last month, including two standout Editor’s Picks, as well as the most discussed and most viewed posts.
MOST DISCUSSED
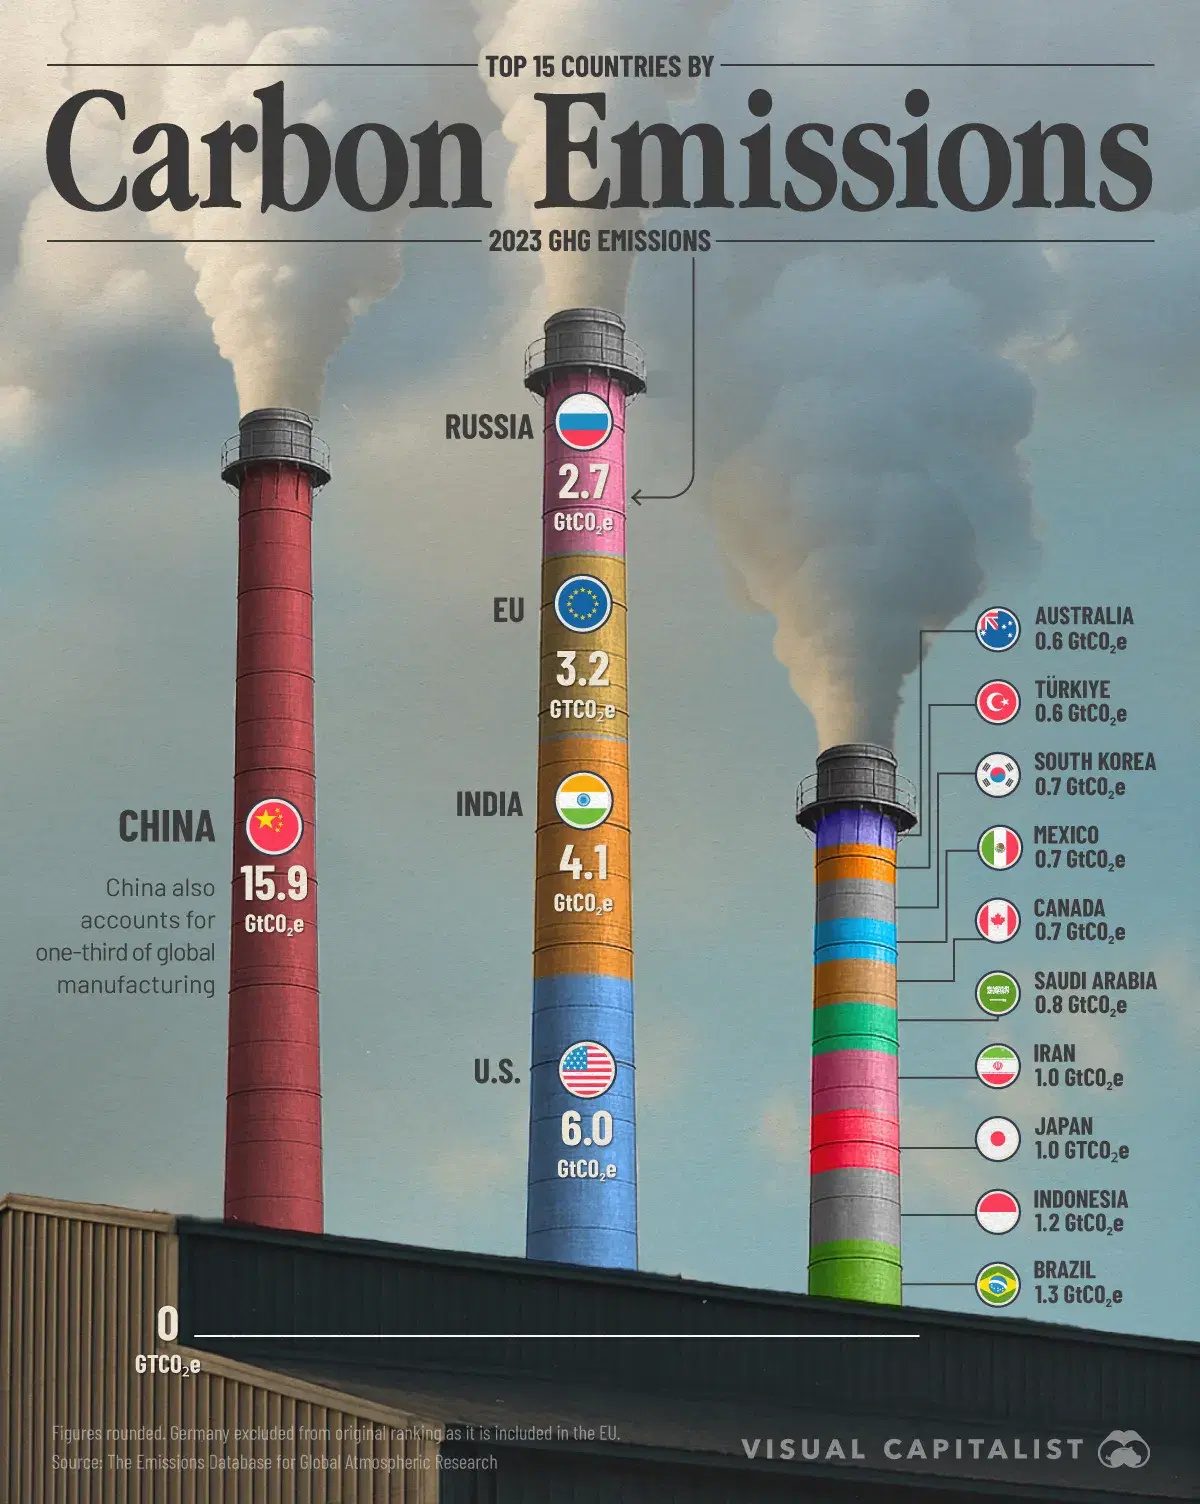
China vs. the World: Carbon Emissions in 2023
A fiery debate unfolded in the comments on this post by Visual Capitalist, which compares emissions from major global economies.
With China accounting for nearly one-third of global greenhouse gas emissions in 2023, users hotly debated the fairness of judging countries on total versus per capita emissions. Others weighed in on the burden developing countries face as they grow without cheap fossil fuels.
The chart also spotlights how wealthy nations, like the U.S., outsource emissions via trade, while resource-rich countries like Saudi Arabia, Canada, and Australia emit more than expected given their population size.
![]() Join the discussion on Voronoi today.
Join the discussion on Voronoi today.
EDITOR’S PICK
Global Trade Dominance: U.S., EU, or China (2000 vs. 2024)
Economist Ehsan Soltani delivers a stunning side-by-side comparison of global trade patterns over two decades.
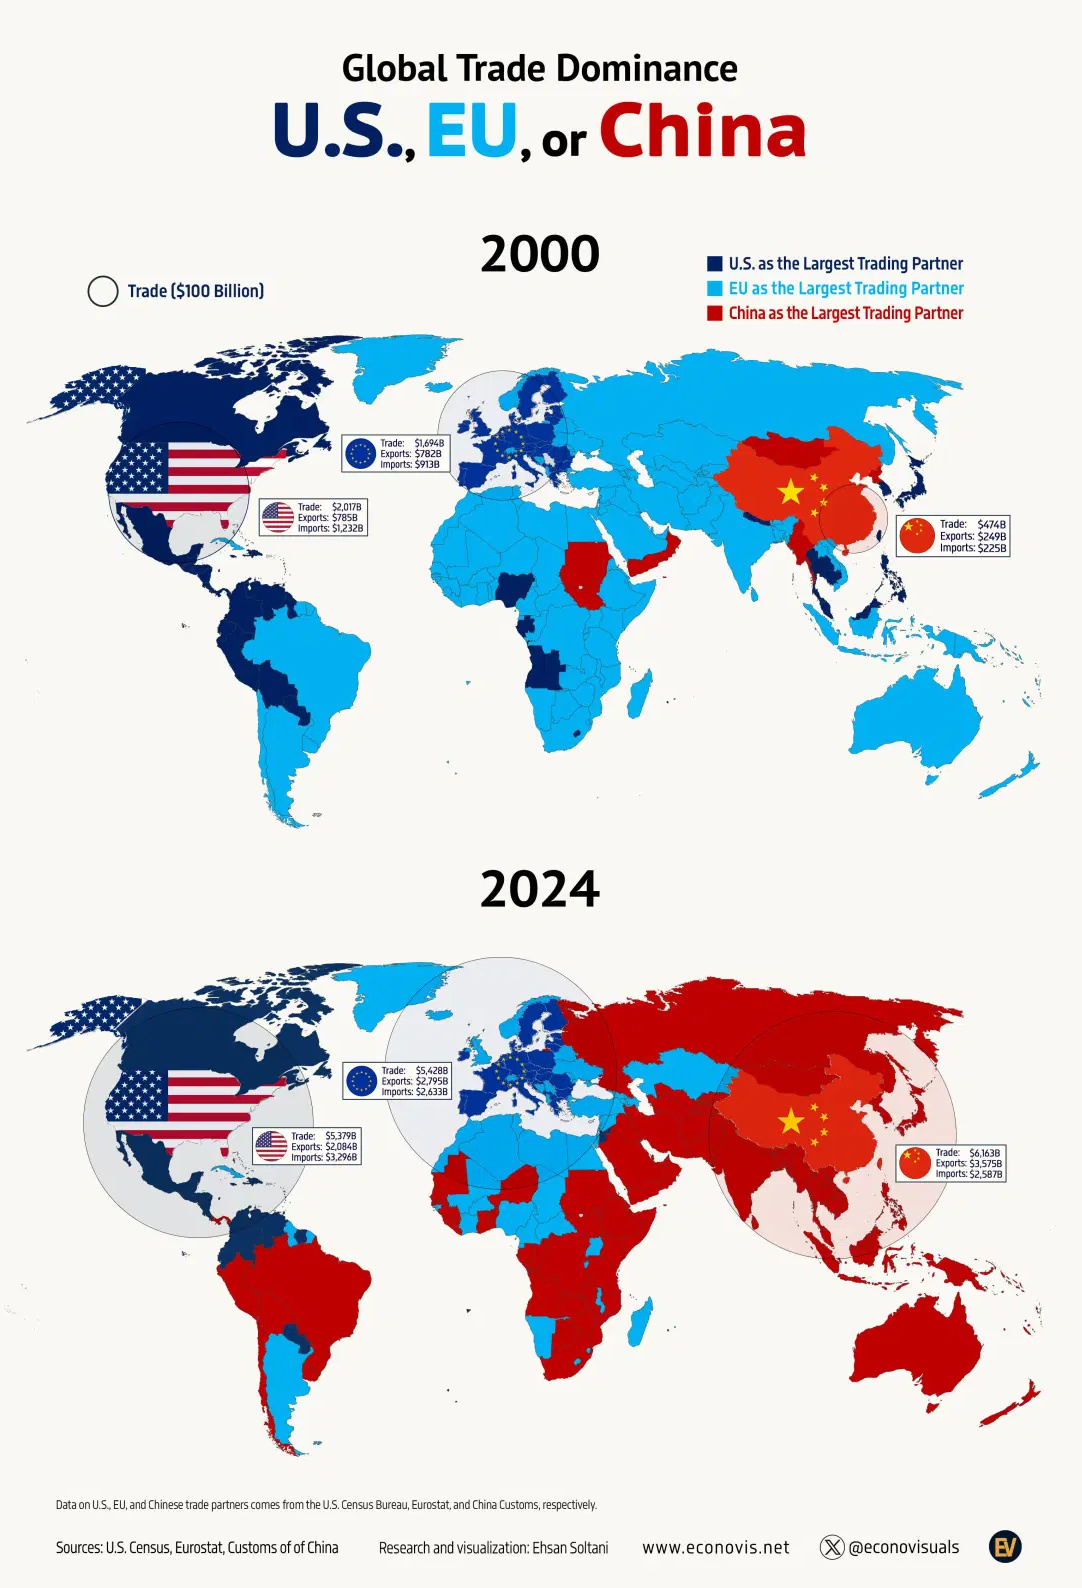
In 2000, the U.S. and EU shared global dominance. But by 2024, China’s meteoric rise made it the top trading partner for most of Asia, Africa, and South America—with $6.2 trillion in trade volume. The U.S. and EU still play critical roles, but the shift marks a fundamental realignment in the world economy.
![]() Dive into the analysis on Voronoi today.
Dive into the analysis on Voronoi today.
MOST VIEWED
Self-Made vs. Inherited Wealth of Billionaires
A global snapshot of wealth origin captivated readers in this data visualization by DataPulse Research.
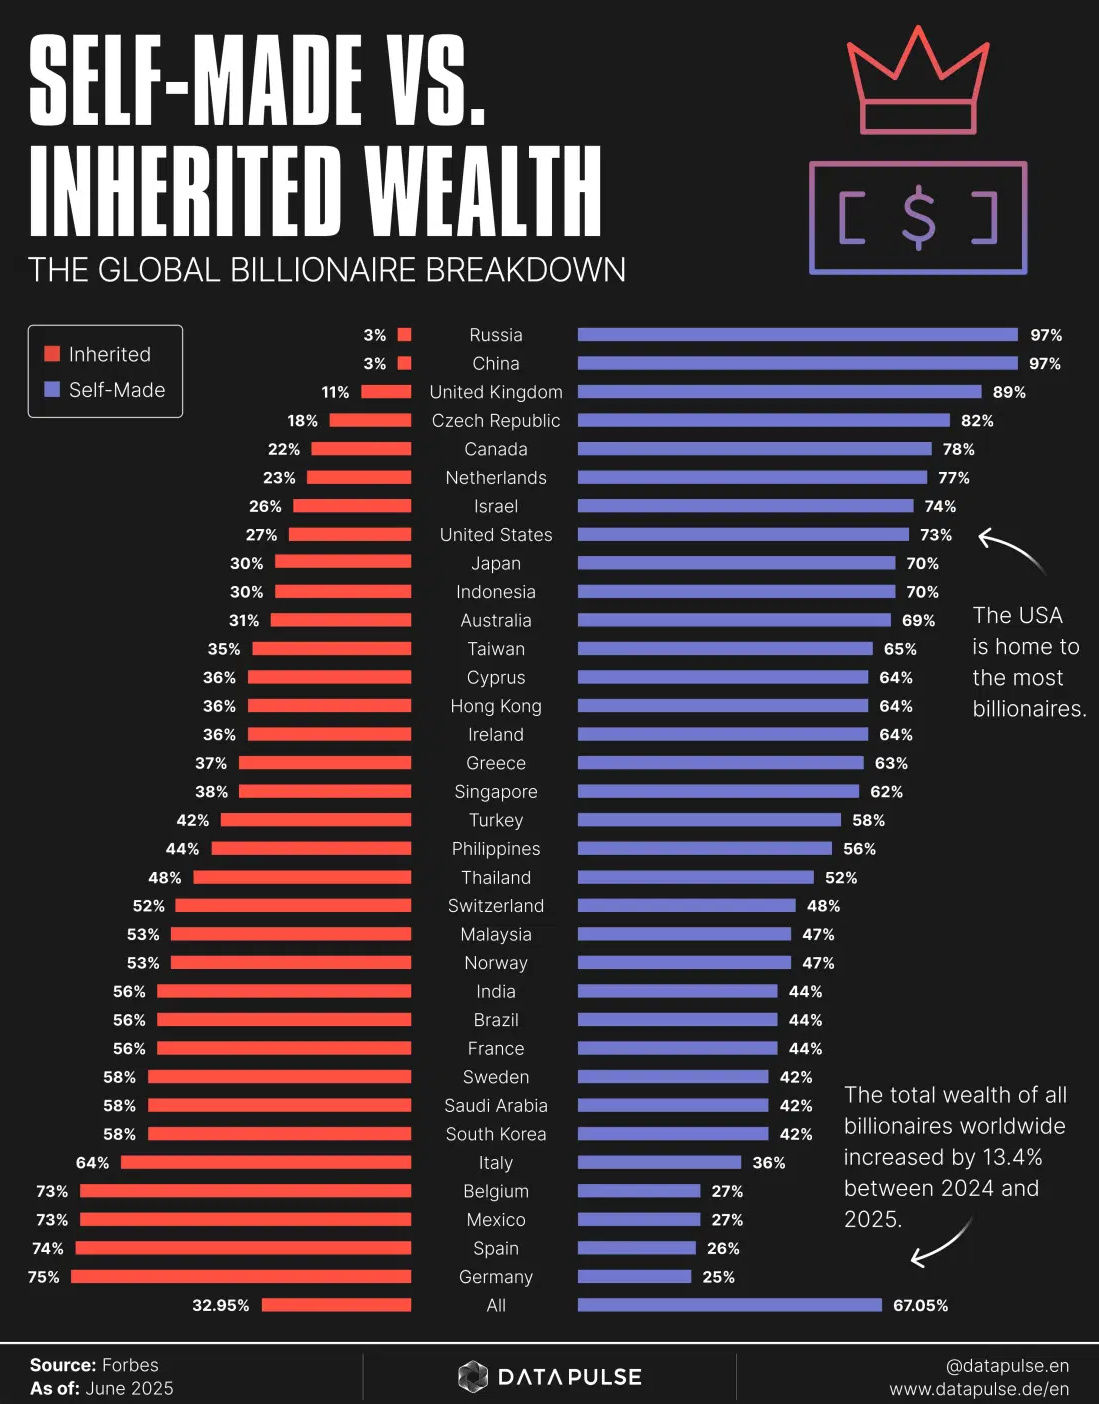
Globally, 67% of billionaires are self-made—but the ratios vary wildly. The U.S. sits above the average at 73%, while Germany lags with only 25%. China and Russia top the list with 97% self-made fortunes each, reflecting their entrepreneurial surges post-liberalization.
![]() Explore the full breakdown on Voronoi today.
Explore the full breakdown on Voronoi today.
EDITOR’S PICK
Which Jobs Are Safest from AI?
As AI reshapes the workforce, this post from Visual Capitalist highlights the roles most likely to stand the test of time.
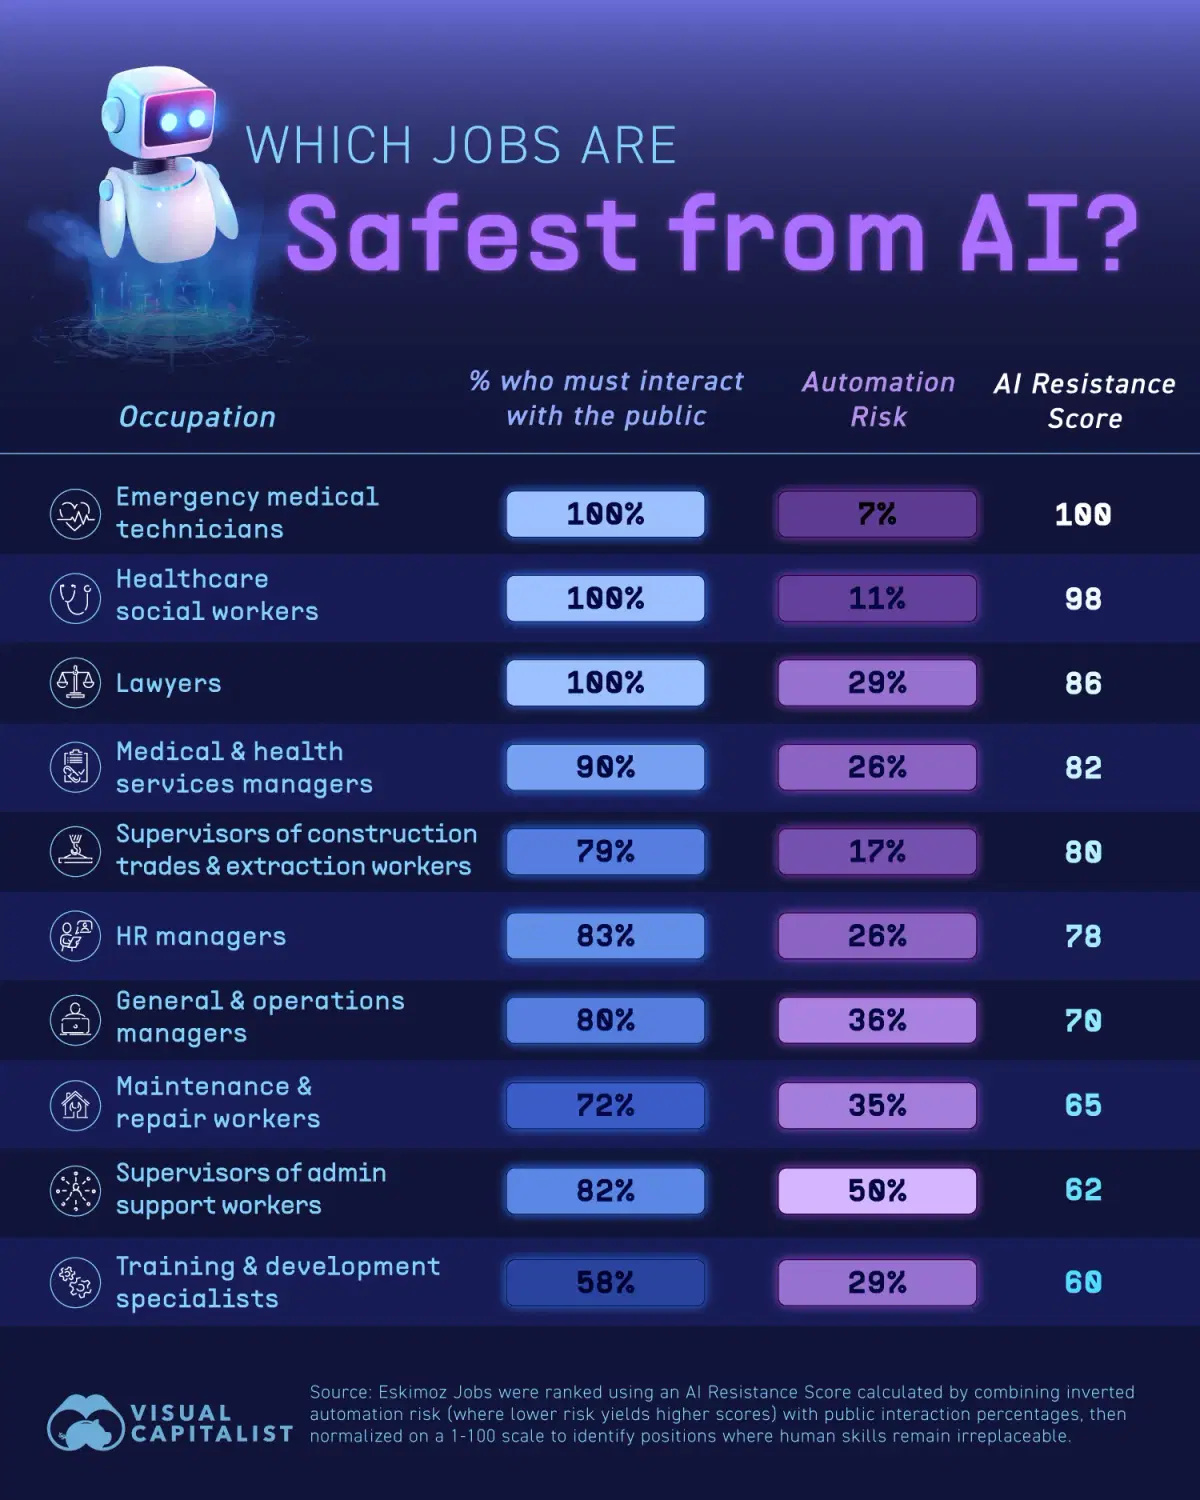
Jobs with high human interaction—like EMTs and social workers—rank safest. So do management and leadership roles that require nuanced decision-making. Skilled trades, which involve dexterity and physical work, also remain resistant to automation.
![]() Explore the full analysis on Voronoi today.
Explore the full analysis on Voronoi today.