![]()
See more visuals like this on the Voronoi app.
Use This Visualization
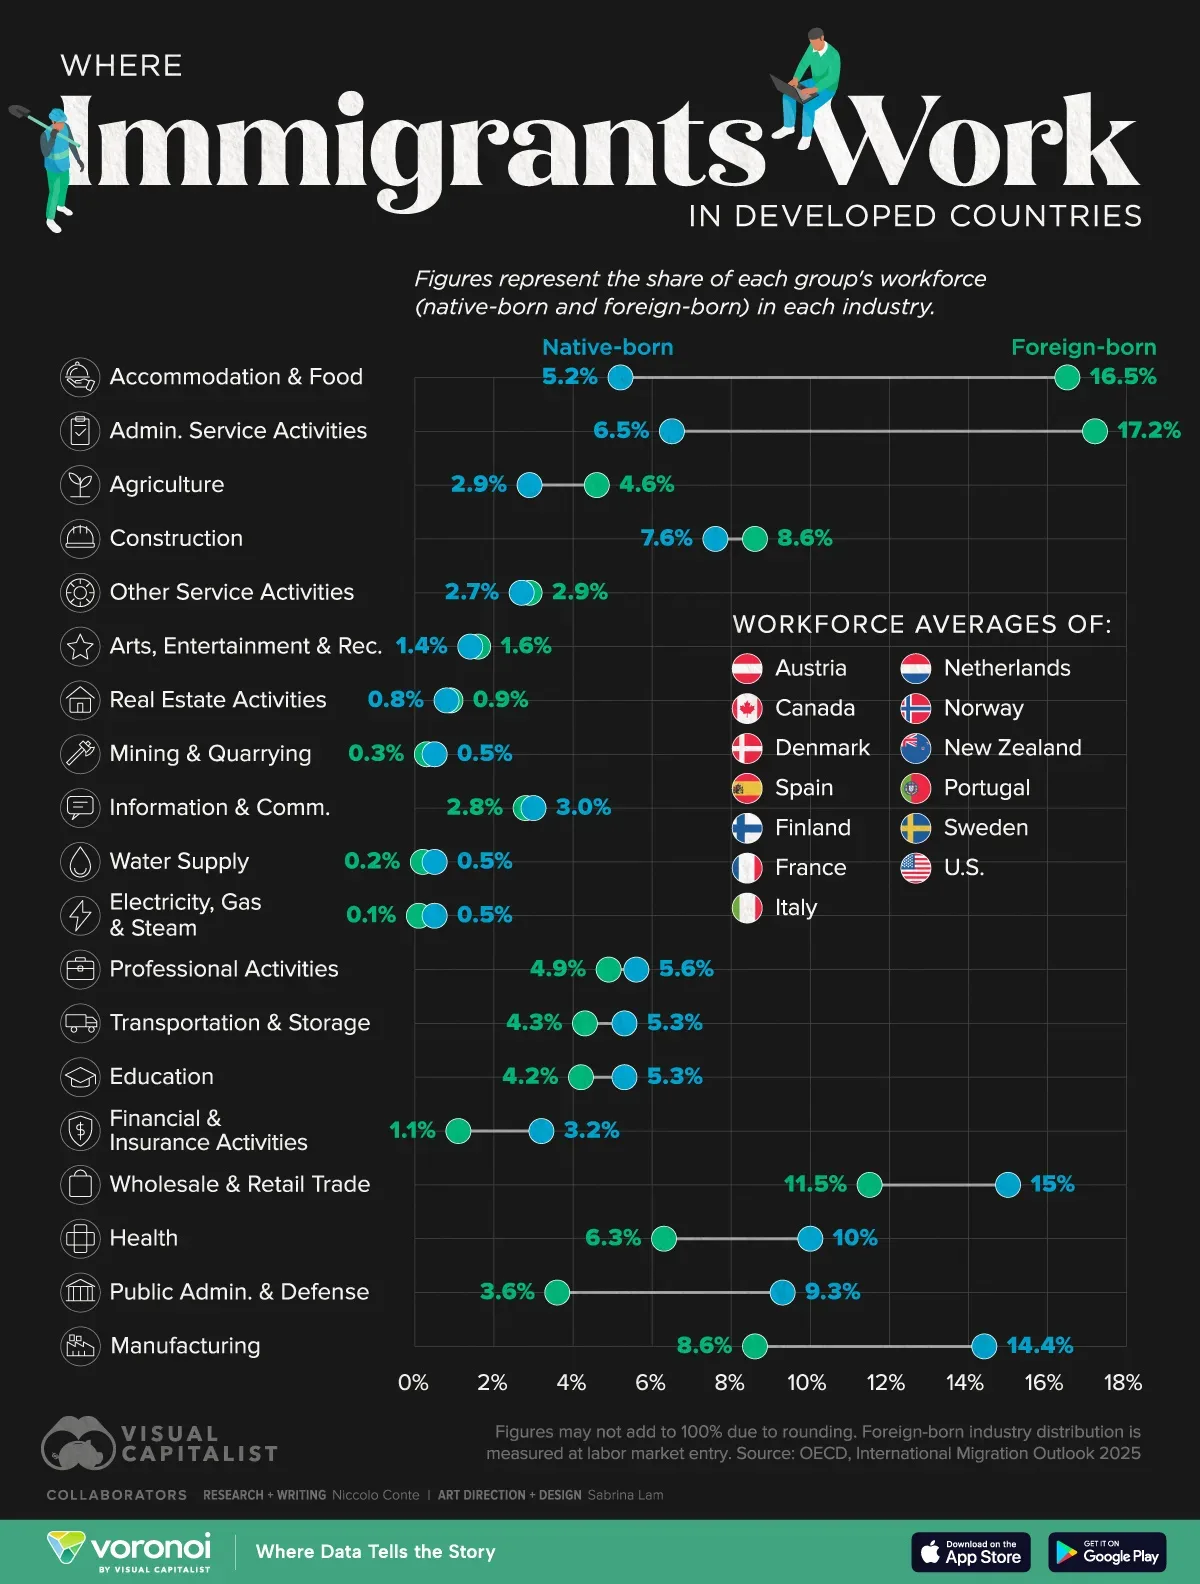
The Industries Most Reliant on Immigrant Workers
See visuals like this from many other data creators on our Voronoi app. Download it for free on iOS or Android and discover incredible data-driven charts from a variety of trusted sources.
Key Takeaways
- Immigrants in developed countries are far more concentrated in hospitality, administrative services, and construction roles.
- Native-born workers dominate public-sector, health, and manufacturing jobs.
Immigrants play a crucial role in the labor markets of developed countries, yet their employment patterns differ significantly from native-born workers. This visualization breaks down where foreign-born workers tend to work across OECD economies.
The data for this visualization comes from the OECD’s International Migration Outlook 2025. It measures the share of foreign-born and native-born workers by industry across several developed countries.
Industries Where Immigrants Are Most Concentrated
Hospitality and administrative services stand out with the highest immigrant share—over 16% in accommodation and food, and 17% in administrative service activities. These sectors often rely on flexible and seasonal labor, making them entry points for newcomers.
Construction also shows a modest immigrant concentration, reflecting long-term demand for skilled and semi-skilled labor. Together, these industries highlight where migration most visibly supports economic activity.
| Industry | Foreign-born (%) | Native-born (%) | Difference (percentage points) |
|---|---|---|---|
| Accommodation and Food | 16.5 | 5.2 | 11.3 |
| Administrative Service Activities | 17.2 | 6.5 | 10.7 |
| Agriculture | 4.6 | 2.9 | 1.7 |
| Construction | 8.6 | 7.6 | 1.1 |
| Other Service Activities | 2.9 | 2.7 | 0.2 |
| Arts, Entertainment and Recreation | 1.6 | 1.4 | 0.1 |
| Real Estate Activities | 0.8 | 0.9 | -0.2 |
| Mining and Quarrying | 0.3 | 0.5 | -0.2 |
| Information and Communication | 2.8 | 3 | -0.2 |
| Water Supply | 0.2 | 0.5 | -0.3 |
| Electricity, Gas and Steam | 0.1 | 0.5 | -0.4 |
| Professional Activities | 4.9 | 5.6 | -0.7 |
| Transportation and Storage | 4.3 | 5.3 | -1 |
| Education | 4.2 | 5.3 | -1.2 |
| Financial and Insurance Activities | 1.1 | 3.2 | -2.2 |
| Wholesale and Retail Trade | 11.5 | 15 | -3.5 |
| Health | 6.3 | 10 | -3.7 |
| Public Administration and Defense | 3.6 | 9.3 | -5.7 |
| Manufacturing | 8.6 | 14.4 | -5.8 |
Industries Dominated by Native-Born Workers
Public administration, health, and manufacturing show the widest gaps in favor of native-born workers. These fields typically require domestic credentials, security clearances, or lengthy training pipelines.
Manufacturing also faces long-standing workforce shortages, yet remains far less accessible to immigrant workers at entry. The result is a structural divide that limits immigrant participation in some of the largest employment sectors.
Neutral or Balanced Sectors
A handful of industries like real estate, arts and entertainment, and other service activities show almost no difference between foreign- and native-born representation. These sectors may offer more flexible entry paths or a mix of small-business and freelance roles.
Learn More on the Voronoi App ![]()
If you enjoyed today’s post, check out Ranked: U.S. Job Cuts by Industry in 2025 on Voronoi, the app from Visual Capitalist.