Published
25 minutes ago
on
October 3, 2025
| 19 views
-->
By
Jenna Ross
Graphics & Design
- Sabrina Fortin
Stablecoin Market Cap vs. the Value of U.S. Cash
Key Takeaways
- Stablecoin market cap has climbed significantly in the last five years.
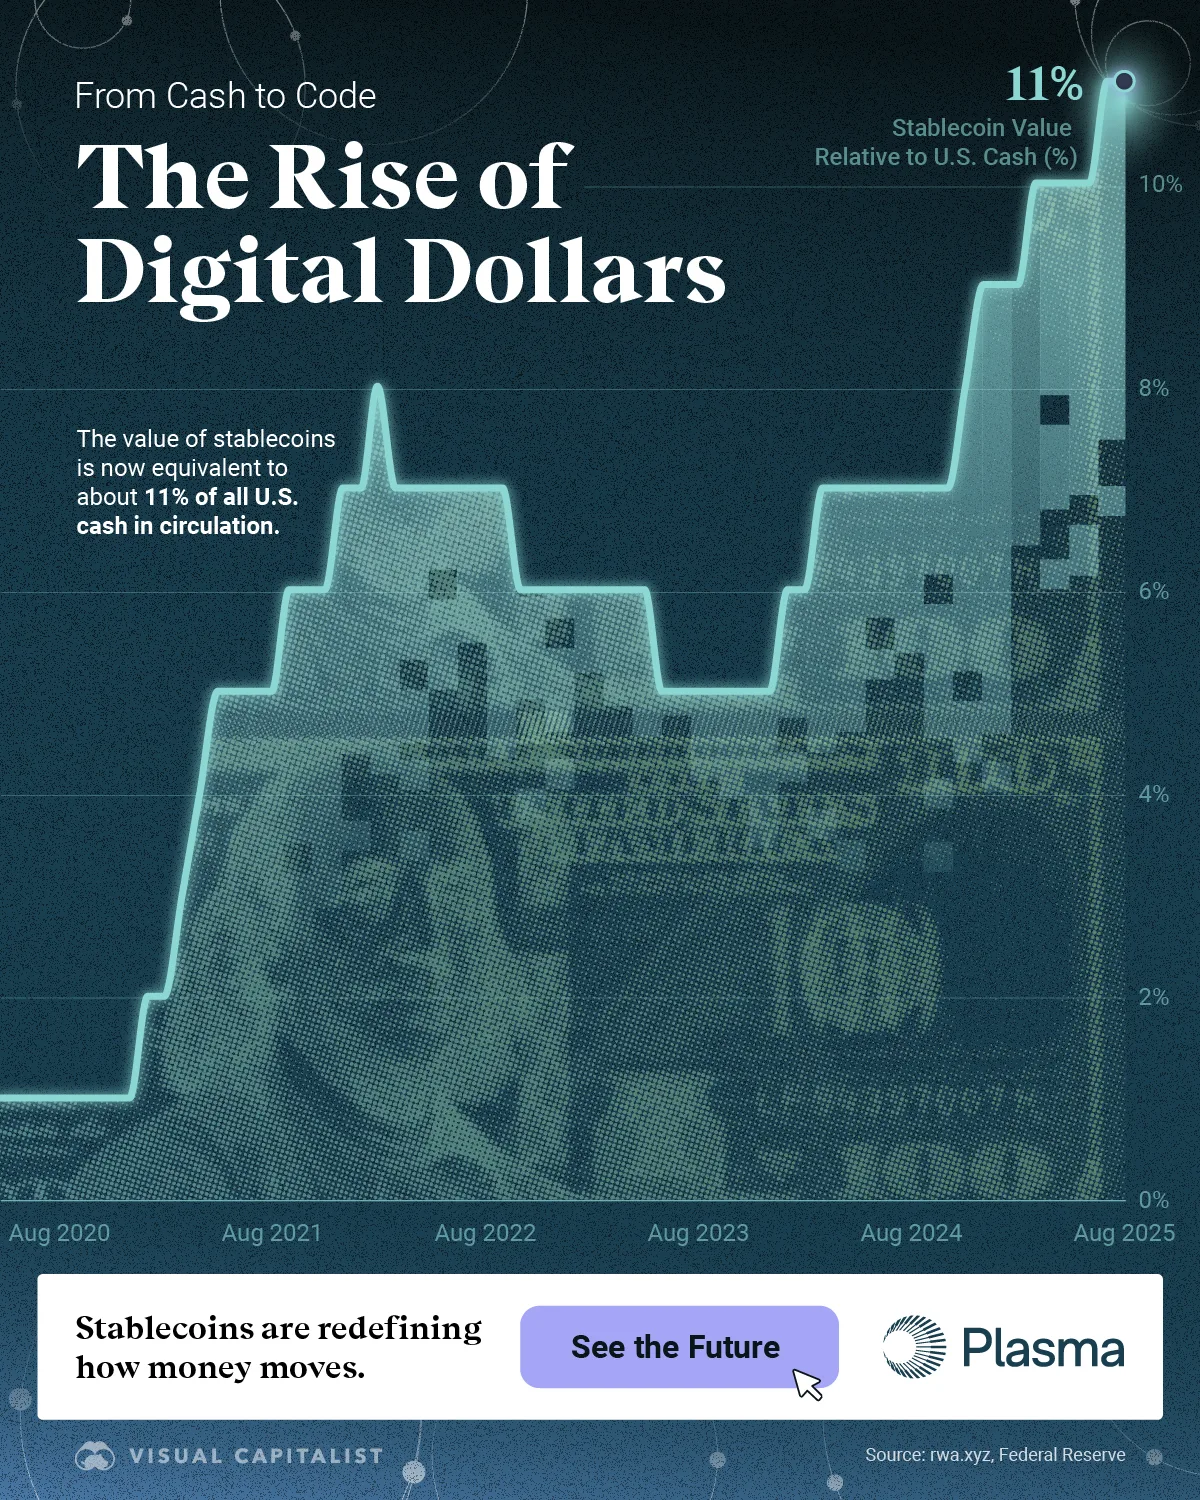
- As of August 2025, the value of stablecoins is now equivalent to about 11% of all U.S. cash in circulation.
The future of money is being built on stablecoins, and it’s happening faster than you think. But just how big is the market capitalization of stablecoins?
Created in partnership with Plasma, this Stablecoin Week graphic compares the value of stablecoins to something everyone is familiar with: U.S. cash.
Stablecoin Market Cap Over Time
Over the last five years, stablecoins have evolved from a small part of cryptocurrency into a major asset redefining money movement.
We’ve measured the stablecoin market cap relative to the value of all U.S. currency in circulation, which includes both paper bills and coins. While they are completely separate assets, the comparison helps gauge the size of the market relative to a traditional fiat currency.
| Date | Stablecoin Market Cap | Value of Physical U.S. Cash in Circulation | Stablecoin Value Relative to Physical U.S. Cash in Circulation |
|---|---|---|---|
| 2020-08-31 | $14,995,891,272 | $2,007,600,000,000 | 1% |
| 2020-09-30 | $18,730,672,205 | $2,027,500,000,000 | 1% |
| 2020-10-31 | $20,824,573,264 | $2,040,500,000,000 | 1% |
| 2020-11-30 | $23,366,206,575 | $2,058,300,000,000 | 1% |
| 2020-12-31 | $27,066,489,065 | $2,071,600,000,000 | 1% |
| 2021-01-31 | $36,107,404,706 | $2,094,200,000,000 | 2% |
| 2021-02-28 | $50,002,218,697 | $2,100,900,000,000 | 2% |
| 2021-03-31 | $61,034,354,590 | $2,117,800,000,000 | 3% |
| 2021-04-30 | $82,222,800,952 | $2,154,800,000,000 | 4% |
| 2021-05-31 | $102,278,169,046 | $2,169,500,000,000 | 5% |
| 2021-06-30 | $107,941,493,724 | $2,179,000,000,000 | 5% |
| 2021-07-31 | $112,426,597,033 | $2,186,300,000,000 | 5% |
| 2021-08-31 | $116,319,147,552 | $2,188,600,000,000 | 5% |
| 2021-09-30 | $125,977,923,956 | $2,195,600,000,000 | 6% |
| 2021-10-31 | $130,658,102,423 | $2,202,800,000,000 | 6% |
| 2021-11-30 | $142,357,761,292 | $2,214,100,000,000 | 6% |
| 2021-12-31 | $152,142,064,103 | $2,225,100,000,000 | 7% |
| 2022-01-31 | $160,382,030,244 | $2,232,700,000,000 | 7% |
| 2022-02-28 | $169,427,715,952 | $2,235,400,000,000 | 8% |
| 2022-03-31 | $169,179,128,131 | $2,259,600,000,000 | 7% |
| 2022-04-30 | $166,966,490,081 | $2,269,600,000,000 | 7% |
| 2022-05-31 | $162,353,272,006 | $2,273,500,000,000 | 7% |
| 2022-06-30 | $153,368,992,942 | $2,277,800,000,000 | 7% |
| 2022-07-31 | $152,835,454,244 | $2,278,300,000,000 | 7% |
| 2022-08-31 | $152,591,289,955 | $2,276,100,000,000 | 7% |
| 2022-09-30 | $149,794,327,663 | $2,279,700,000,000 | 7% |
| 2022-10-31 | $147,142,145,621 | $2,284,600,000,000 | 6% |
| 2022-11-30 | $143,802,031,584 | $2,293,100,000,000 | 6% |
| 2022-12-31 | $142,127,153,500 | $2,298,700,000,000 | 6% |
| 2023-01-31 | $139,228,507,019 | $2,299,100,000,000 | 6% |
| 2023-02-28 | $136,357,978,261 | $2,299,800,000,000 | 6% |
| 2023-03-31 | $132,683,654,126 | $2,313,100,000,000 | 6% |
| 2023-04-30 | $131,145,861,182 | $2,323,700,000,000 | 6% |
| 2023-05-31 | $129,778,342,105 | $2,334,000,000,000 | 6% |
| 2023-06-30 | $126,078,748,644 | $2,342,900,000,000 | 5% |
| 2023-07-31 | $124,471,885,870 | $2,339,100,000,000 | 5% |
| 2023-08-31 | $122,928,016,834 | $2,331,100,000,000 | 5% |
| 2023-09-30 | $121,544,474,931 | $2,327,600,000,000 | 5% |
| 2023-10-31 | $121,906,788,736 | $2,324,700,000,000 | 5% |
| 2023-11-30 | $126,408,535,893 | $2,327,900,000,000 | 5% |
| 2023-12-31 | $128,369,111,994 | $2,335,200,000,000 | 5% |
| 2024-01-31 | $135,591,618,738 | $2,336,300,000,000 | 6% |
| 2024-02-29 | $144,427,480,131 | $2,328,800,000,000 | 6% |
| 2024-03-31 | $152,838,157,862 | $2,339,400,000,000 | 7% |
| 2024-04-30 | $161,777,888,234 | $2,345,200,000,000 | 7% |
| 2024-05-31 | $162,575,379,043 | $2,348,500,000,000 | 7% |
| 2024-06-30 | $162,067,722,652 | $2,351,700,000,000 | 7% |
| 2024-07-31 | $165,136,487,249 | $2,351,200,000,000 | 7% |
| 2024-08-31 | $171,369,742,355 | $2,348,700,000,000 | 7% |
| 2024-09-30 | $173,528,046,070 | $2,351,200,000,000 | 7% |
| 2024-10-31 | $173,123,543,395 | $2,355,200,000,000 | 7% |
| 2024-11-30 | $193,251,176,330 | $2,359,400,000,000 | 8% |
| 2024-12-31 | $203,321,054,581 | $2,363,400,000,000 | 9% |
| 2025-01-31 | $215,411,867,785 | $2,358,300,000,000 | 9% |
| 2025-02-28 | $222,620,885,927 | $2,352,500,000,000 | 9% |
| 2025-03-31 | $228,706,619,101 | $2,366,900,000,000 | 10% |
| 2025-04-30 | $234,637,347,100 | $2,378,000,000,000 | 10% |
| 2025-05-31 | $238,864,697,313 | $2,385,600,000,000 | 10% |
| 2025-06-30 | $244,661,365,220 | $2,392,800,000,000 | 10% |
| 2025-07-31 | $256,459,140,209 | $2,399,900,000,000 | 11% |
| 2025-08-31 | $272,945,166,554 | $2,404,500,000,000 | 11% |
Source: rwa.xyz, Federal Reserve
In 2020, the value of stablecoins was equivalent to just 1% of all physical U.S. dollars. However, their market cap surged in 2021 alongside the broader crypto bull market. Stablecoins grew quickly because they are widely used as a parking spot for funds to move in and out of crypto trades.
At the same time, issuers began investing their reserves in interest-earning assets, pocketing the profits on stablecoins that paid no yield. Meanwhile, smart contracts on blockchains gave stablecoin holders new ways to earn yield by lending, providing liquidity, or farming rewards. These opportunities made stablecoins even more popular.
The stablecoin market cap temporarily dropped in 2022 and 2023 in response to a broader crypto crash and the collapse of TerraUSD (UST), an algorithmic stablecoin that lost its $1 peg. Since then, trust in stablecoins has been rebuilt through fiat-backed stablecoins with 1:1 liquid asset reserves, greater transparency requirements, and emerging regulatory frameworks.
The Rise of Digital Dollars
In 2024 and 2025, the value of stablecoins has been steadily climbing. In fact, the stablecoin market cap is equivalent to 11% of all physical U.S. cash in circulation as of August 2025.
The growing popularity is being fueled by a number of factors:
- The broader crypto market has recovered, boosting stablecoin use in crypto trades.
- Adoption is growing as regulations provide clarity.
- Both consumers and businesses are using stablecoins to make payments, including cross-border payments that are much cheaper and faster with stablecoins.
- The industry continues to innovate, with the first interest-bearing stablecoin approved by the SEC in February 2025.
- Stablecoins are becoming increasingly integrated with traditional finance, with many financial institutions already offering or planning to explore stablecoin offerings.
With the next era of money well underway, Plasma is building a foundational blockchain designed specifically for global stablecoin payments.
You may also like
-

Blockchain7 months ago
Mapped: Crypto Taxation Around the World
This map displays capital gains tax rates for individual crypto investors worldwide.
-

Markets11 months ago
Charted: How Much Bitcoin is One Ethereum Worth?
Ethereum’s value relative to bitcoin (ETH/BTC) is at multi-year lows. Could this indicate an impending ethereum rally?
-

Blockchain11 months ago
Visualizing the Rise of Bitcoin’s Hashrate
The bitcoin hashrate—the collective computing power used in mining bitcoin—is soaring to record highs, rising over sixfold since late 2019.
-

Media3 years ago
The Evolution of Media: Visualizing a Data-Driven Future
Media and information delivery is transforming at an increasing pace. Here’s why the future will be more data-driven, transparent, and verifiable.
-

Technology4 years ago
A Visual Guide to Profile Picture NFTs
Feeling bored on social media? Consider investing in profile picture NFTs, one of the most popular digital assets being traded today.
-

Blockchain4 years ago
Visualizing the Power Consumption of Bitcoin Mining
Bitcoin mining requires significant amounts of energy, but what does this consumption look like when compared to countries and companies?
Subscribe
Please enable JavaScript in your browser to complete this form.Join 375,000+ email subscribers: *Sign Up