
See more visuals like this on the Voronoi app.
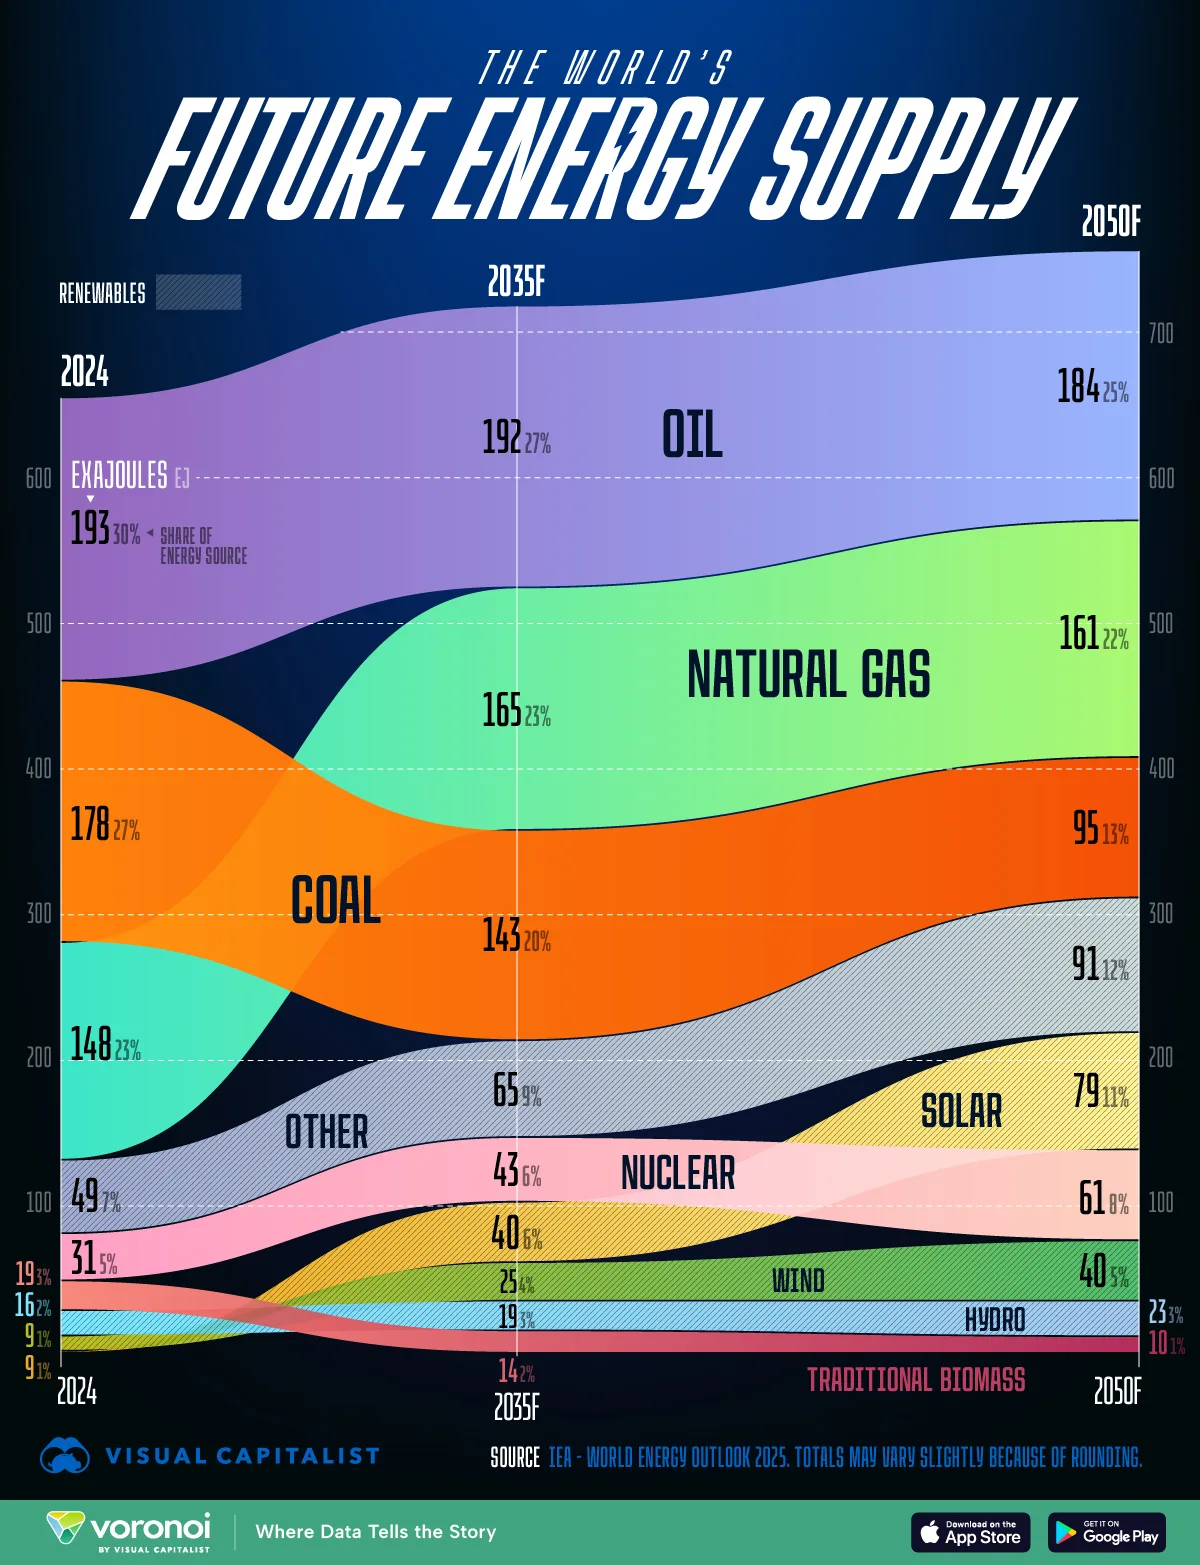
The Future of World Energy Supply (2024–2050), Charted
See visuals like this from many other data creators on our Voronoi app. Download it for free on iOS or Android and discover incredible data-driven charts from a variety of trusted sources.
Key Takeaways
- Between 2024 and 2050, nearly all net new global energy supply comes from renewables.
- Coal declines sharply while oil and gas flatten, shifting the long-term balance of the energy mix.
The world’s energy system is undergoing its most significant transition in modern history. While demand continues to rise, the types of energy supplying that demand are shifting at an accelerating pace. This chart highlights how global energy supply evolves from 2024 to 2050, showing which sources grow, plateau, or decline.
The data for this visualization comes from the IEA World Energy Outlook 2025. It outlines global energy supply in exajoules (EJ) from 2024 through forecasts for 2035 and 2050.
Renewables Become the Core of New Supply
Renewables more than double from 83 EJ in 2024 to 233 EJ by 2050, rising from 13% to 31% of global supply. Solar and wind make up most of this increase, with solar alone growing nearly ninefold over the forecast period. Hydro continues to rise more gradually. By 2050, renewables represent the largest source of net new global energy.
| Exajoules (EJ) | 2024 | 2035F | 2050F |
|---|---|---|---|
| Solar | 9 | 40 | 79 |
| Wind | 9 | 25 | 40 |
| Hydro | 16 | 19 | 23 |
| Other renewables | 49 | 65 | 91 |
| Traditional biomass | 19 | 14 | 10 |
| Nuclear | 31 | 43 | 61 |
| Natural gas | 148 | 165 | 161 |
| Oil | 193 | 192 | 184 |
| Coal | 178 | 143 | 95 |
| Renewables (total) | 83 | 149 | 233 |
| Total energy supply | 654 | 708 | 747 |
Fossil Fuels Flatten as Coal Declines
Coal shows the steepest drop, falling from 178 EJ in 2024 to just 95 EJ by 2050. This reflects both policy-driven phase-downs and competitive pressure from clean technologies.
Nuclear and Other Low-Carbon Sources Expand
Nuclear grows steadily from 31 EJ in 2024 to 61 EJ in 2050, maintaining a small but meaningful role in global baseload power. Traditional biomass declines as regions transition to modern energy systems. Meanwhile, “other” renewables—such as geothermal and modern bioenergy—expand significantly, helping diversify the low-carbon supply portfolio.
Learn More on the Voronoi App
If you enjoyed today’s post, check out Visualizing Future Solar Power Capacity by Country on Voronoi, the new app from Visual Capitalist.