How Balanced Is Economic Development Within Countries?
Levels of economic development differ not only from one country to another, but also dramatically within their own borders.
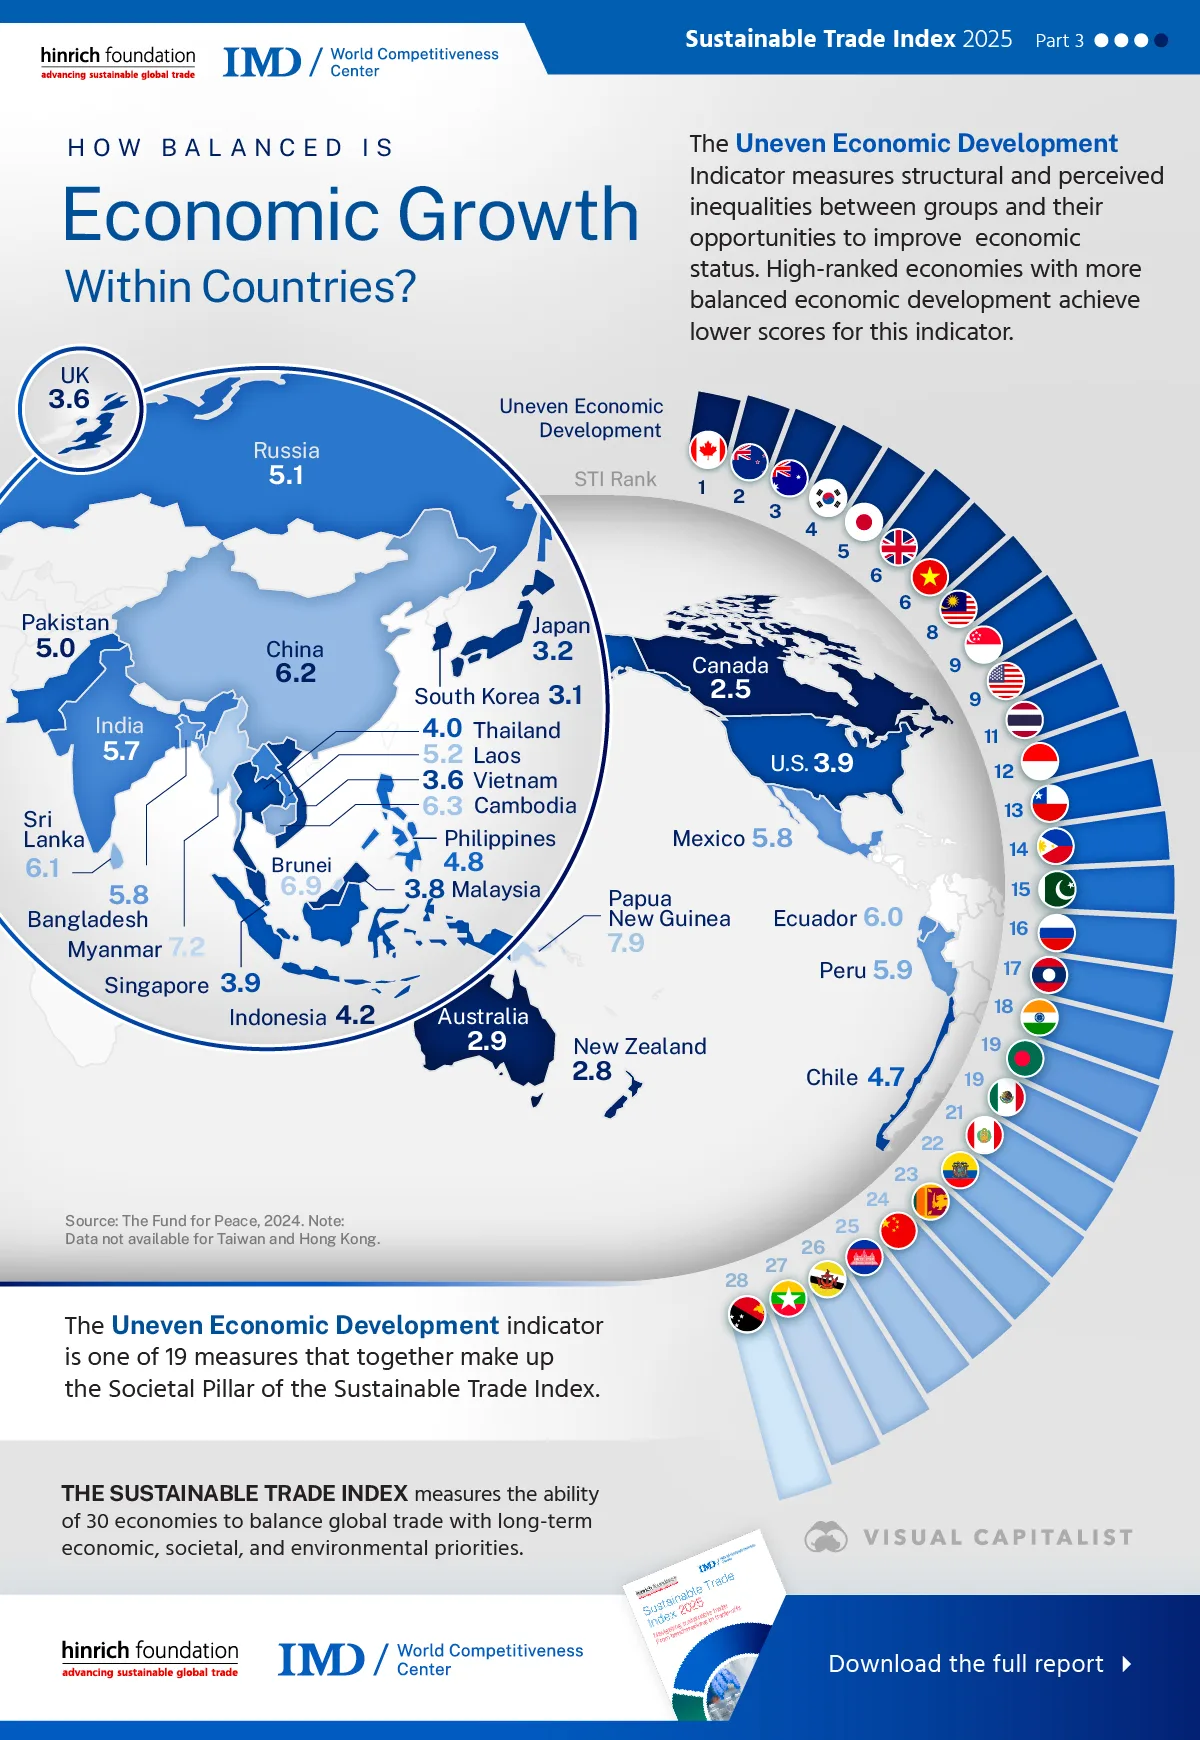
This visualization, created in partnership with Hinrich Foundation, compares the evenness of economic development within countries, using data from the Fund for Peace.
The analysis comes from the 2025 Sustainable Trade Index (STI), which the Hinrich Foundation produced in collaboration with the IMD World Competitiveness Center.
Uneven Economic Development
The Uneven Economic Development Indicator captures both structural and perceived inequalities across groups, focusing on their relative opportunities to improve economic well-being. It serves as a sub-indicator within the Economics category of the Fragile States Index, developed by the Fund for Peace.
This measure examines three core dimensions: economic equality, access to opportunity, and socio-economic dynamics. Economies that demonstrate more balanced and inclusive development tend to score lower on the indicator, reflecting greater stability and resilience.
Which Countries Lead in Economic Evenness?
Canada, New Zealand, and Australia take the lead when it comes to economic evenness. Their strong performance on the Uneven Economic Development indicator stems from robust social safety nets, high levels of human development, and policies designed to redistribute wealth more equitably.
| Rank | Country | Uneven Economic Development (score) | Uneven Economic Development (index) |
|---|---|---|---|
| 1 | Canada | 100.0 | 2.5 |
| 2 | New Zealand | 94.4 | 2.8 |
| 3 | Australia | 92.6 | 2.9 |
| 4 | South Korea | 88.9 | 3.1 |
| 5 | Japan | 87.0 | 3.2 |
| 6 | United Kingdom | 79.6 | 3.6 |
| 6 | Vietnam | 79.6 | 3.6 |
| 8 | Malaysia | 75.9 | 3.8 |
| 9 | Singapore | 74.1 | 3.9 |
| 9 | United States | 74.1 | 3.9 |
| 11 | Thailand | 72.2 | 4.0 |
| 12 | Indonesia | 68.5 | 4.2 |
| 13 | Chile | 59.3 | 4.7 |
| 14 | Philippines | 57.4 | 4.8 |
| 15 | Pakistan | 53.7 | 5.0 |
| 16 | Russia | 51.9 | 5.1 |
| 17 | Laos | 50.0 | 5.2 |
| 18 | India | 40.7 | 5.7 |
| 19 | Bangladesh | 38.9 | 5.8 |
| 19 | Mexico | 38.9 | 5.8 |
| 21 | Peru | 37.0 | 5.9 |
| 22 | Ecuador | 35.2 | 6.0 |
| 23 | Sri Lanka | 33.3 | 6.1 |
| 24 | China | 31.5 | 6.2 |
| 25 | Cambodia | 29.6 | 6.3 |
| 26 | Brunei | 18.5 | 6.9 |
| 27 | Myanmar | 13.0 | 7.2 |
| 28 | Papua New Guinea | 0.0 | 7.9 |
Rounding out the top five are South Korea and Japan, while the United States places further down the list at #9.
Which Countries Lag in Economic Evenness?
In contrast, emerging markets tend to struggle with balanced economic growth. The lowest-ranked countries on this indicator are Papua New Guinea, Myanmar, Brunei, Cambodia, and China—highlighting the challenges these economies face in achieving more even distribution of wealth and opportunity.
Explore the Sustainable Trade Index
This infographic was just a small subset of what the Sustainable Trade Index has to offer. To learn more, visit the Hinrich Foundation, where you can download additional resources including the entire report for free.