
See more visualizations like this on the Voronoi app.
How Much Control China Has Over the World’s Critical Minerals
See visuals like this from many other data creators on our Voronoi app. Download it for free on iOS or Android and discover incredible data-driven charts from a variety of trusted sources.
Key Takeaways
- China is the biggest producer for the majority of the materials listed.
- Other key players include Brazil, the Democratic Republic of Congo, and South Africa, each dominating select strategic materials.
China sits at the center of today’s global mineral supply chains. From electric vehicles to semiconductors, many of the technologies driving modern industry depend on critical minerals that are mined, refined, or controlled by China.
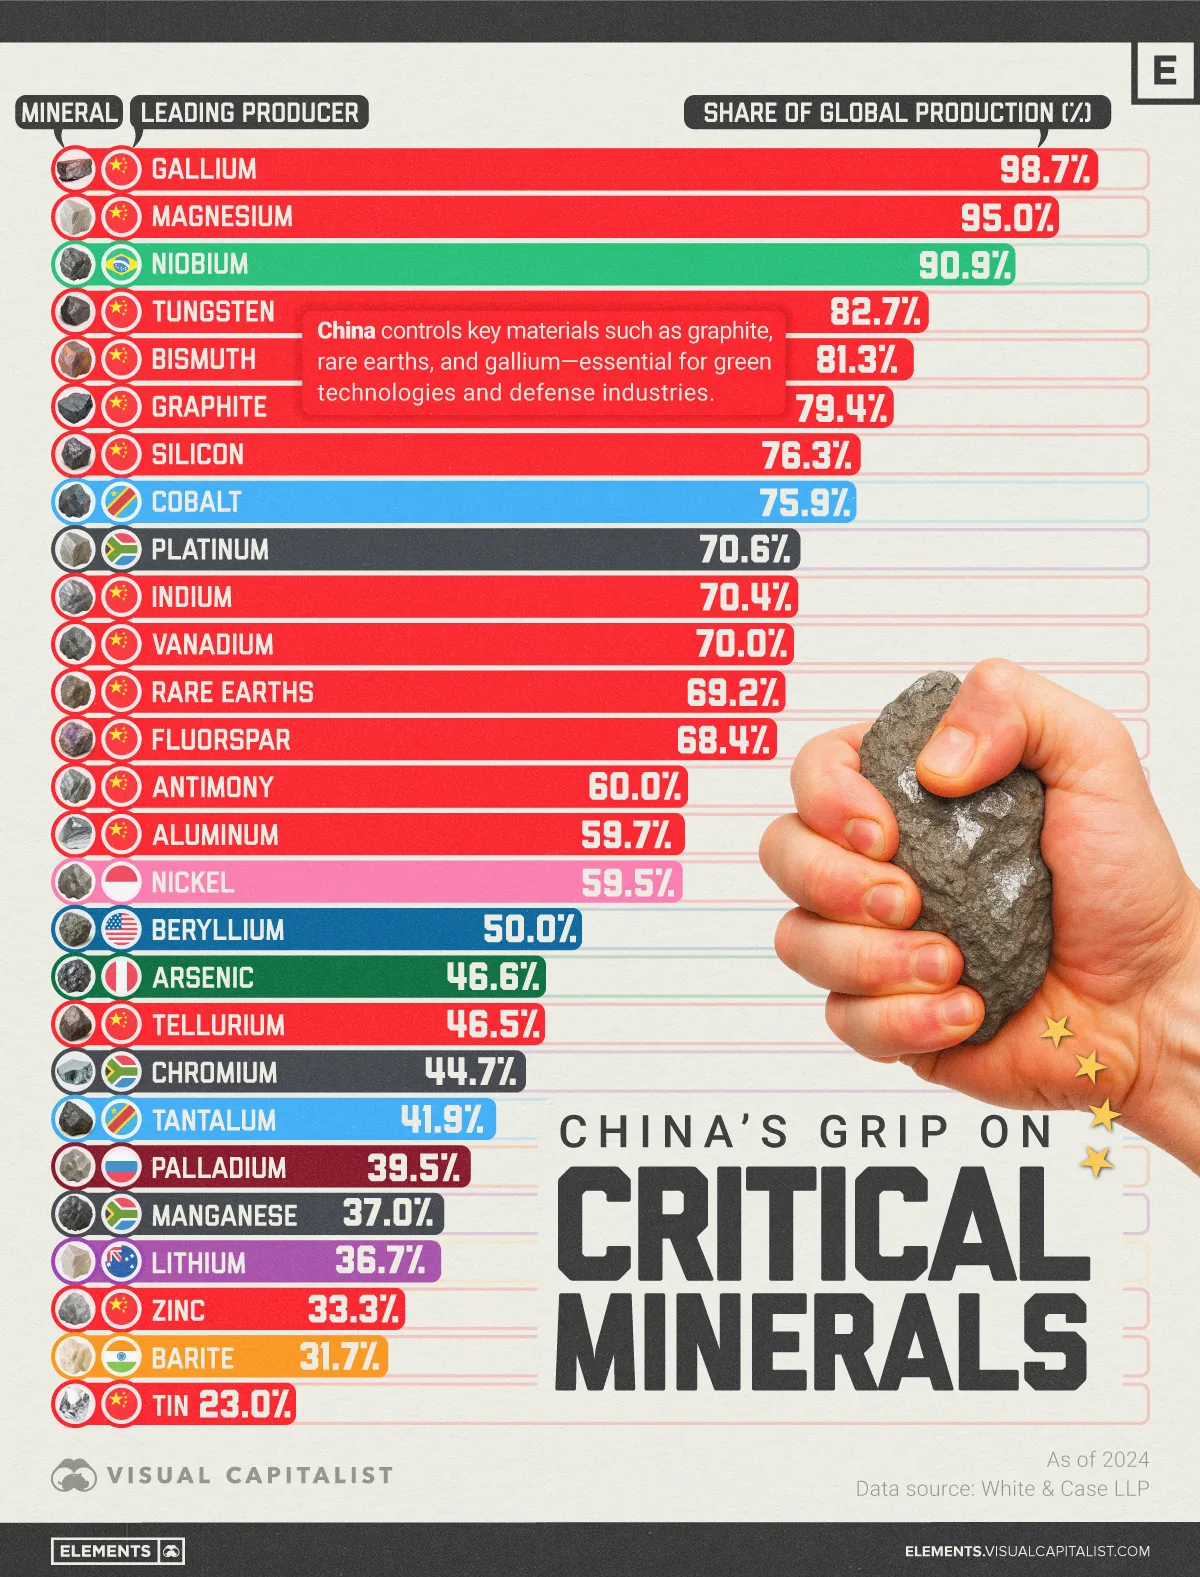
This visualization highlights just how concentrated global mineral production has become. The data for this graphic comes from White & Case LLP. It charts the top global producers for 27 key critical minerals, as of December 2024.
China’s Commanding Share
China dominates the production of at least 15 critical minerals or mineral groups listed, including gallium (98.7%), magnesium (95%), tungsten (82.7%), and rare earths (69.2%). These materials are vital for clean energy, defense, and electronics.
In addition to being the leading producer, the country also controls much of the refining capacity for many of these minerals. For example, around 90% of rare earths are refined in China.
This monopoly has become a major concern for other nations, with the Trump administration currently pushing for increased domestic production of these materials.
| Mineral | Major Producer | Global Production (%) |
|---|---|---|
| Gallium | China | 98.7% |
| Magnesium | China | 95.0% |
| Niobium | Brazil | 90.9% |
| Tungsten | China | 82.7% |
| Bismuth | China | 81.3% |
| Graphite | China | 79.4% |
| Silicon | China | 76.3% |
| Cobalt | DR Congo | 75.9% |
| Platinum | South Africa | 70.6% |
| Indium | China | 70.4% |
| Vanadium | China | 70.0% |
| Rare Earths | China | 69.2% |
| Fluorspar | China | 68.4% |
| Antimony | China | 60.0% |
| Aluminum | China | 59.7% |
| Nickel | Indonesia | 59.5% |
| Beryllium | U.S. | 50.0% |
| Arsenic | Peru | 46.6% |
| Tellurium | China | 46.5% |
| Chromium | South Africa | 44.7% |
| Tantalum | DR Congo | 41.9% |
| Palladium | Russia | 39.5% |
| Manganese | South Africa | 37.0% |
| Lithium | Australia | 36.7% |
| Zinc | China | 33.3% |
| Barite | India | 31.7% |
| Tin | China | 23.0% |
Regional Specializations Beyond China
While China’s dominance is unparalleled, a few other nations play essential roles. Brazil accounts for nearly 91% of global niobium production, a mineral critical for high-strength steel used in pipelines and jet engines.
The Democratic Republic of Congo holds 75.9% of cobalt and 41.9% of tantalum production—both indispensable for batteries and microelectronics.
South Africa is another heavyweight, supplying 70.6% of the world’s platinum and nearly half of all chromium.
Western Efforts to Rebalance Supply Chains
Australia, the United States, and other Western nations have sought to diversify production and reduce dependence on Chinese materials.
Australia now leads global lithium output with 36.7%, helping anchor non-Chinese EV supply chains. Meanwhile, the U.S. remains the world’s largest beryllium producer, accounting for half of total global supply. Still, overall Chinese dependency remains high.
Learn More on the Voronoi App
If you enjoyed today’s post, check out Why Rare Earths Are Critical to EV Motors on Voronoi, the new app from Visual Capitalist.