![]()
See more visualizations like this on the Voronoi app.
Use This Visualization
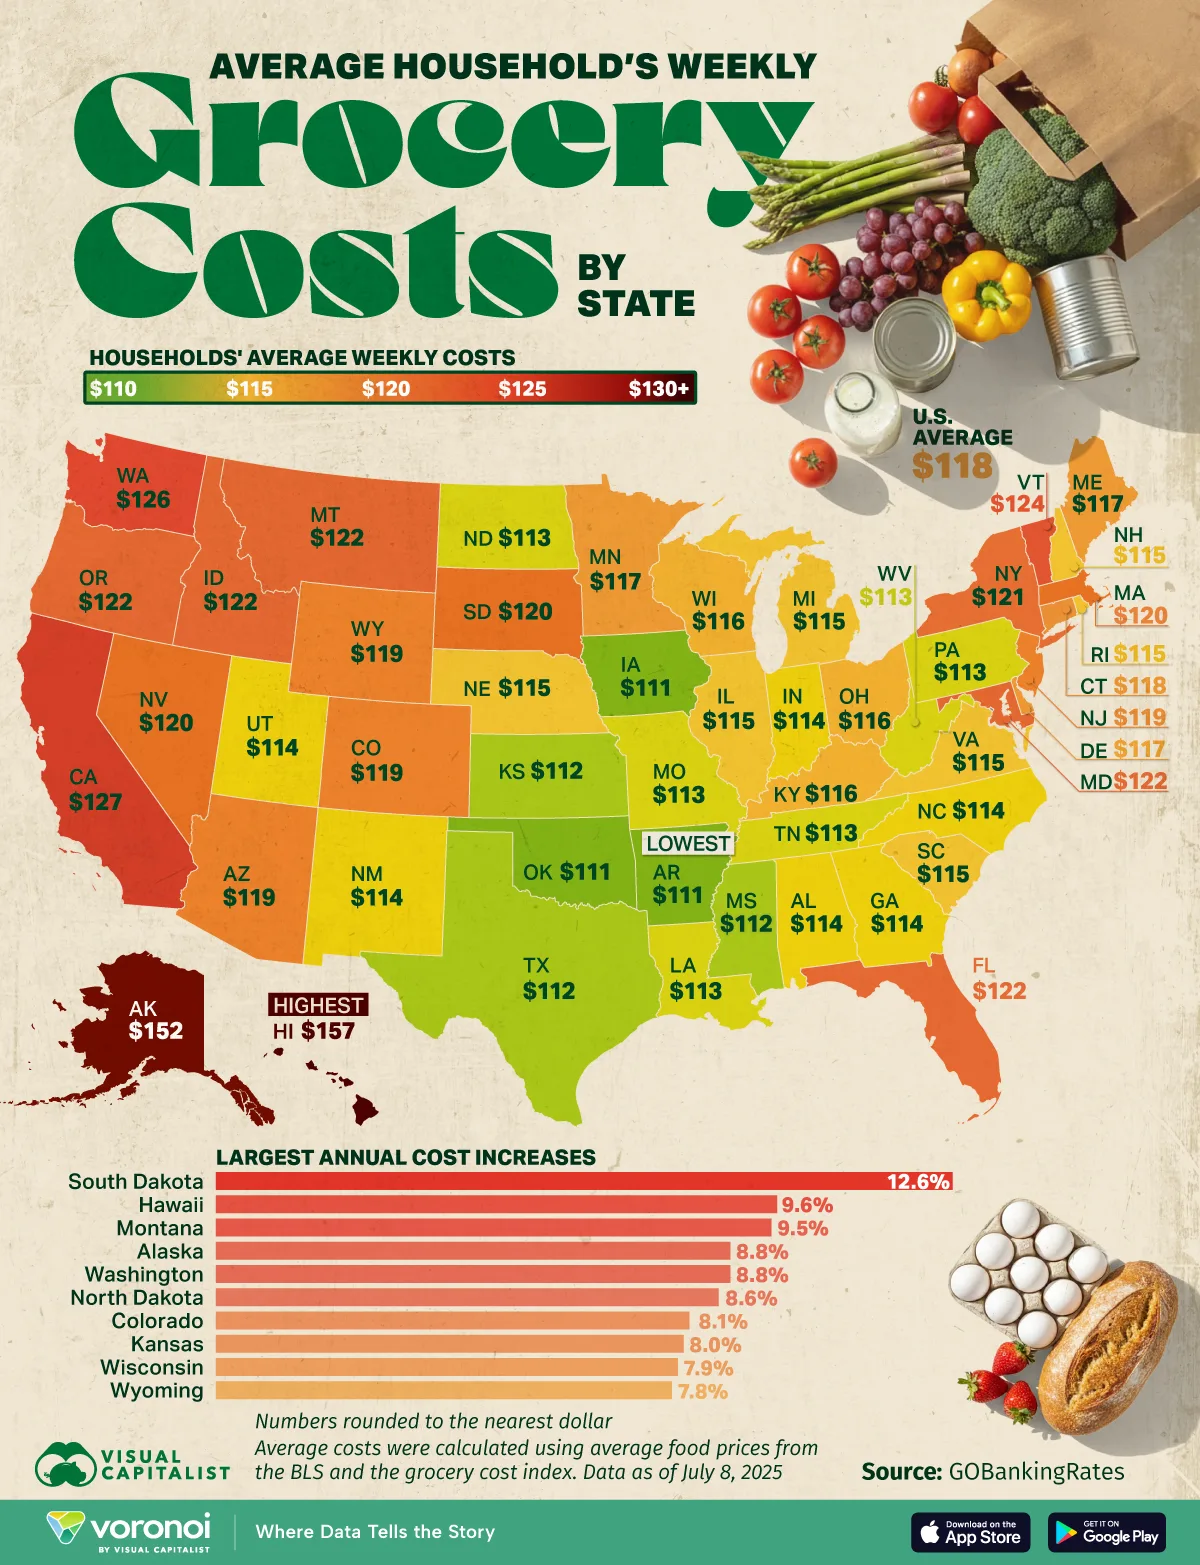
Mapped: Each State’s Average Weekly Grocery Bill
See visuals like this from many other data creators on our Voronoi app. Download it for free on iOS or Android and discover incredible data-driven charts from a variety of trusted sources.
Key Takeaways
- Hawaiian households spent 33% more on groceries than the U.S. average in 2025, footing the highest grocery bills across the country.
- Overall, average spending at the supermarket climbed 6.3% nationally as of July 8, 2025.
Costs at the grocery store keep marching higher, but some states are feeling the strain more than others.
Nationwide, ground beef prices jumped 15% in 2025, while orange juice spiked 21%. Moreover, the price for a carton of eggs hit a record-high of $8.15 in March, however prices have dropped meaningfully since then.
This graphic shows the average grocery bill by state in 2025, based on data from GOBankingRates.
Hawaii Leads the U.S. in Average Weekly Grocery Bills
Below, we show the average weekly grocery cost for a median-income household in each state, based on analysis of Bureau of Labor Statistics price indexes. Data is as of July 8, 2025.
| State | Average Weekly Grocery Costs 2025 | Annual Cost Increase |
|---|---|---|
| Hawaii | $157 | 9.6% |
| Alaska | $152 | 8.8% |
| California | $127 | 3.4% |
| Washington | $126 | 8.8% |
| Vermont | $124 | 6.3% |
| Florida | $122 | 6.0% |
| Oregon | $122 | 5.0% |
| Maryland | $122 | 4.2% |
| Montana | $122 | 9.5% |
| Idaho | $122 | 7.0% |
| New York | $121 | 6.3% |
| South Dakota | $120 | 12.6% |
| Nevada | $120 | 5.8% |
| Massachusetts | $120 | 4.4% |
| Colorado | $119 | 8.1% |
| New Jersey | $119 | 4.5% |
| Arizona | $119 | 7.6% |
| Wyoming | $119 | 7.8% |
| Connecticut | $118 | 5.0% |
| Minnesota | $117 | 4.7% |
| Maine | $117 | 4.9% |
| Delaware | $117 | 3.7% |
| Kentucky | $116 | 6.0% |
| Ohio | $116 | 6.9% |
| Wisconsin | $116 | 7.9% |
| Rhode Island | $115 | 3.1% |
| South Carolina | $115 | 5.7% |
| Michigan | $115 | 6.9% |
| Nebraska | $115 | 5.8% |
| Virginia | $115 | 5.4% |
| New Hampshire | $115 | 5.0% |
| Illinois | $115 | 6.6% |
| Utah | $114 | 6.6% |
| Indiana | $114 | 6.9% |
| New Mexico | $114 | 7.8% |
| North Carolina | $114 | 5.4% |
| Georgia | $114 | 6.6% |
| Alabama | $114 | 6.6% |
| Pennsylvania | $113 | 4.2% |
| North Dakota | $113 | 8.6% |
| West Virginia | $113 | 3.7% |
| Louisiana | $113 | 6.8% |
| Tennessee | $113 | 5.7% |
| Missouri | $113 | 6.9% |
| Kansas | $112 | 8.0% |
| Mississippi | $112 | 5.7% |
| Texas | $112 | 5.8% |
| Oklahoma | $111 | 6.5% |
| Iowa | $111 | 5.2% |
| Arkansas | $111 | 6.0% |
| U.S. Average | $118 | 6.3% |
In Hawaii, households spend $157 per week on groceries, up 9.6% from the prior year.
Not only is this among the fastest annual increases across states, grocery bills are 33% higher than the national average. Dairy, bread, and poultry are among the items that cost substantially more than the mainland given the state’s reliance on imports.
Alaska follows, with prices increasing 8.8% annually. Within the state, prices can vary dramatically, particularly for rural communities that are not accessible by road. While a bag of chips can cost $6.79 in Anchorage, it climbs to $10.49 in Unalakleet.
As we can see, California prices rank third-highest nationally, up 3.4% compared to July 2024. Higher wages, rent, utilities, and distribution costs all contribute to elevated prices.
On the opposite end of the spectrum are several Southern states. Residents in Arkansas spend the least on groceries, at about 6% lower than the U.S. average. Oklahoma, Texas, Mississippi, and Kansas also rank near the bottom due to comparatively lower costs of living.
Learn More on the Voronoi App ![]()
To learn more about this topic, check out this graphic on the U.S. cities with the highest grocery costs.