Published
45 mins ago
on
February 22, 2024
| 50 views
-->
By
Jenna Ross
Graphics & Design
- Athul Alexander
The following content is sponsored by Fidelity Investments
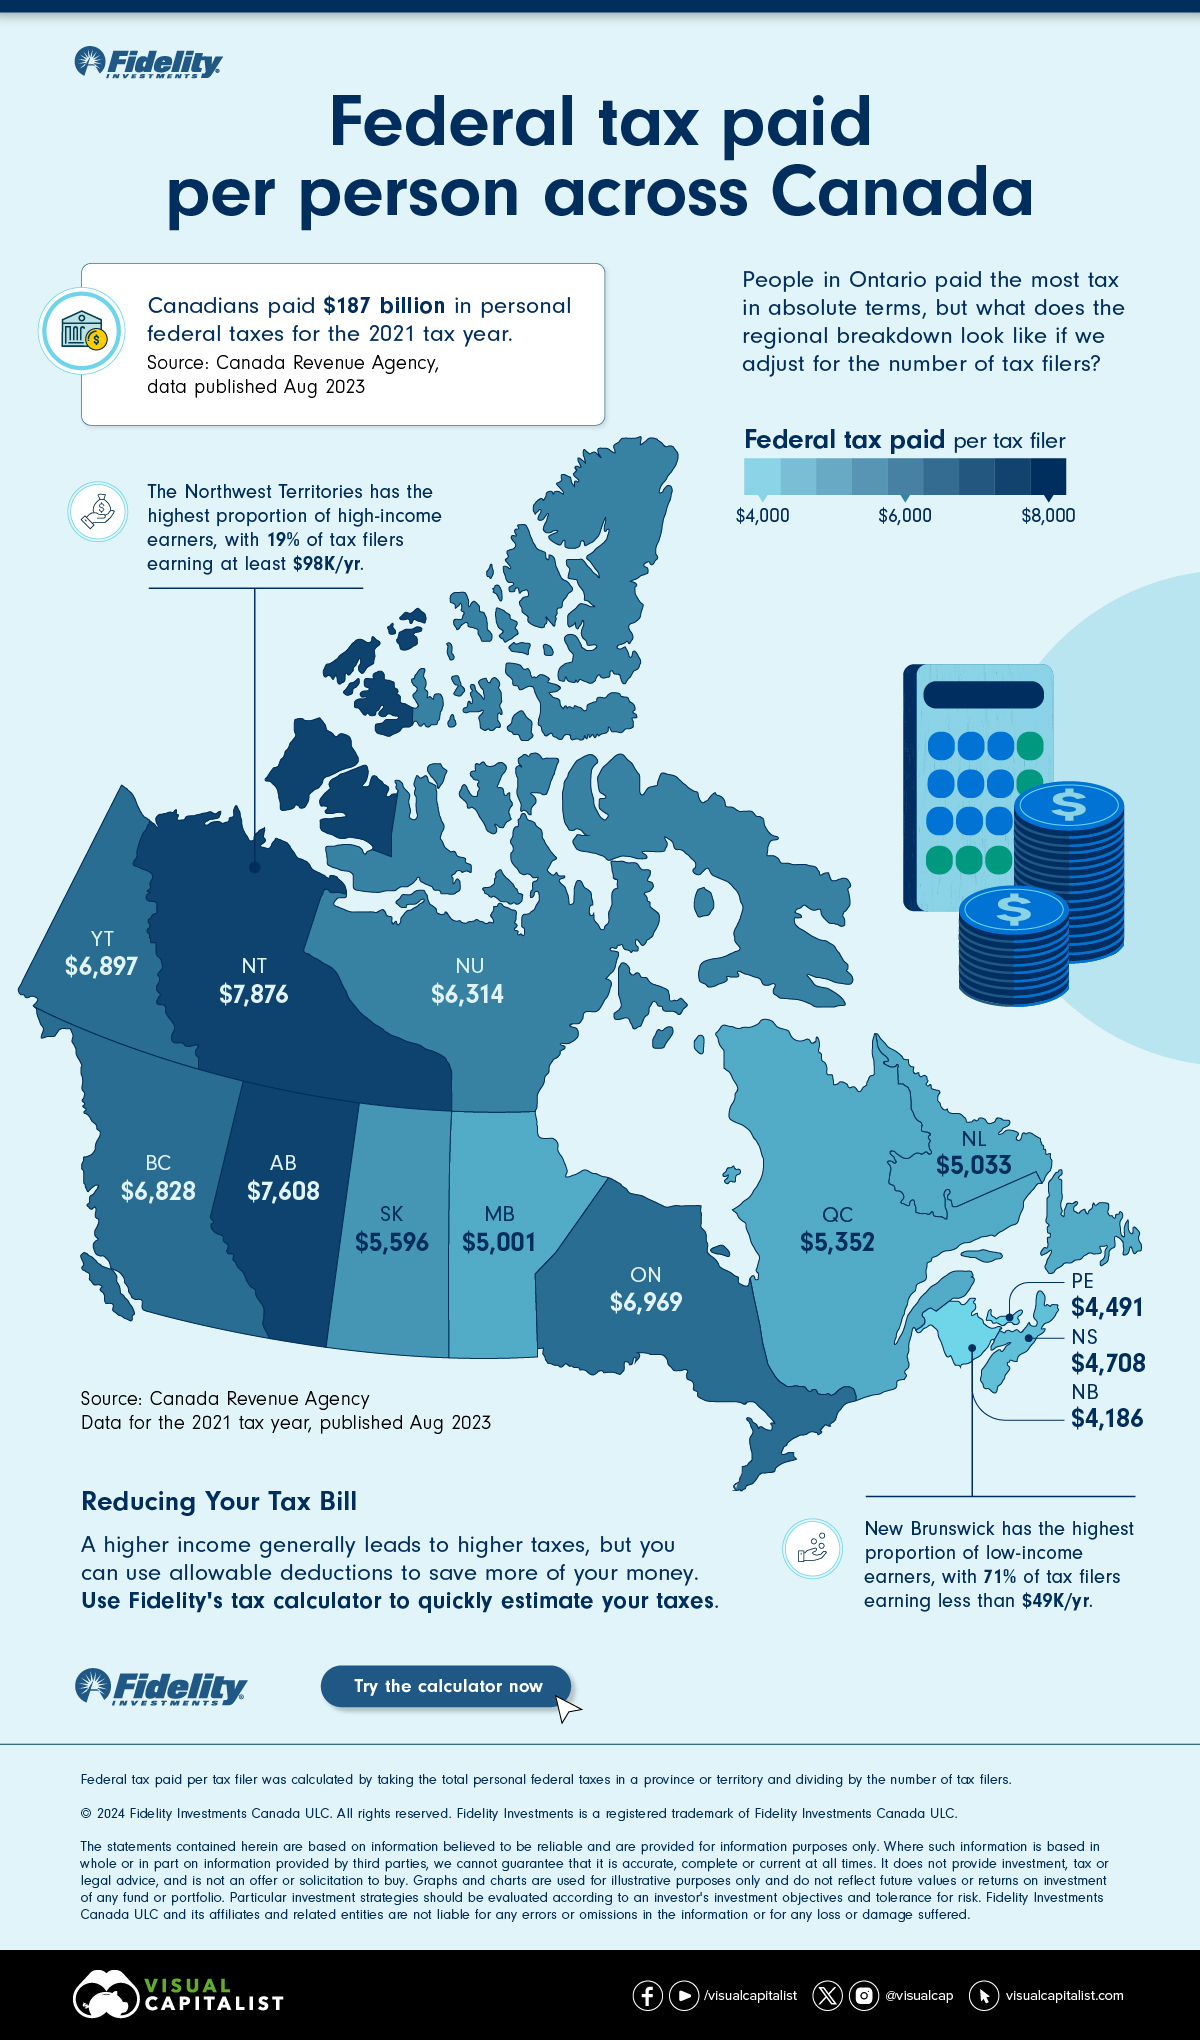
Mapped: Federal Tax Paid Per Capita Across Canada
Which parts of Canada pay the most personal tax? In 2021, according to the latest available data, people in Ontario paid by far the greatest share: 42% of the total. Of course, Ontario is also the most populated province.
But if we look at which parts of the country paid the most and least taxes on a per capita basis, the picture looks different. In this graphic from Fidelity Investments, we show the amount paid per tax filer for each province and territory.
A Breakdown of Tax Per Person
We took the total personal federal tax paid in each province according to 2021 tax filing data from the Canada Revenue Agency. We then divided the total tax paid by the number of people filing taxes in the province. Below, we rank the provinces and territories from least to most taxes on this basis.
| Province or Territory | Federal Tax Paid Per Person |
|---|---|
| New Brunswick | $4,186 |
| Prince Edward Island | $4,491 |
| Nova Scotia | $4,708 |
| Manitoba | $5,001 |
| Newfoundland and Labrador | $5,033 |
| Quebec | $5,352 |
| Saskatchewan | $5,596 |
| Nunavut | $6,314 |
| British Columbia | $6,828 |
| Yukon | $6,897 |
| Ontario | $6,969 |
| Alberta | $7,608 |
| Northwest Territories | $7,876 |
| All of Canada | $6,368 |
All of Canada is calculated as the total federal taxes paid in Canada divided by the total number of tax filers in Canada.
New Brunswick paid the least taxes on a per capita basis. Within the province, 13% of people worked in retail jobs, the highest proportion nationally. Retail positions in New Brunswick earned $34,000 annually on average. As a whole, 71% of people in New Brunswick earned less than $49,000 per year.
The Highest Taxes Per Capita
The Northwest Territories (NWT) paid the most taxes relative to the number of tax filers. Public administration workers made up nearly a quarter of tax filers, four times the national share of 6%. These workers, which include local, provincial, federal, and aboriginal government employees, had an average annual income of $120,000 in the NWT.
Additionally, the territory also had a relatively high proportion of people working in mining, who earned $221,000 a year on average.
However, it’s important to note that the NWT faces a high cost of living. On average, households in the capital city of Yellowknife paid 28% more for food and 47% more for shelter than the average Canadian household in 2021.
On a per person basis, Ontario paid the third highest taxes in Canada. The province had the highest proportion of finance and insurance workers, who earned $106,000 annually.
Reducing Your Taxes
Generally, a higher income leads to higher taxes. However, you can explore allowable deductions such as RRSP contributions to save more of your money.
![]()
Use Fidelity’s income tax calculator to quickly estimate your taxes.

Please enable JavaScript in your browser to complete this form.Enjoying the data visualization above? *Subscribe
Related Topics: #canada #tax #fidelity #fidelity investments #Federal taxes #Taxes per capita #Personal taxes #Canadian taxes
Click for Comments
var disqus_shortname = "visualcapitalist.disqus.com";
var disqus_title = "Mapped: Federal Tax Paid Per Capita Across Canada";
var disqus_url = "https://www.visualcapitalist.com/sp/federal-tax-paid-per-capita-across-canada/";
var disqus_identifier = "visualcapitalist.disqus.com-164548";
You may also like
-

Money1 month ago
Ranked: The Top 25 Countries for Retirement
Of the 44 nations analyzed for retirement welfare, these 25 score well on health, financial, and social support for their aging populations.
-

Money1 month ago
Charted: Top 10 Retirement Planning Mistakes
What are the top retirement planning mistakes people make? Here are the top 10 common mistakes to avoid as seen by financial professionals.
-

Money2 months ago
Charted: Investment Preferences by Generation in the U.S.
How personal are your investments? We chart investment preferences by generation in the U.S. based on a survey of 2,200 investors in 2023.
-
Real Estate4 months ago
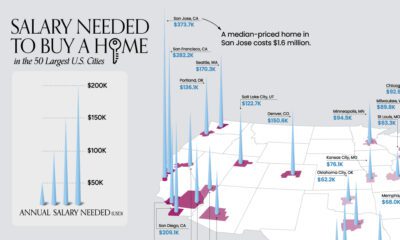
Mapped: What You Need to Earn to Own a Home in 50 American Cities
What does it take to own a home in the U.S. in 2023? Here’s a look at the salary needed for home ownership in the top…
-

Pensions5 months ago
Charted: Retirement Age by Country
We chart current and effective retirement ages for 45 countries, revealing some stark regional differences.
-

Wealth6 months ago
Visualizing $156 Trillion in U.S. Assets, by Generation
We’ve visualized data from the Federal Reserve to provide a comprehensive break down of U.S. assets by generation.
Subscribe
Please enable JavaScript in your browser to complete this form.Join the 375,000+ subscribers who receive our daily email *Sign Up
The post Mapped: Federal Tax Paid Per Capita Across Canada appeared first on Visual Capitalist.