
See more visualizations like this on the Voronoi app.
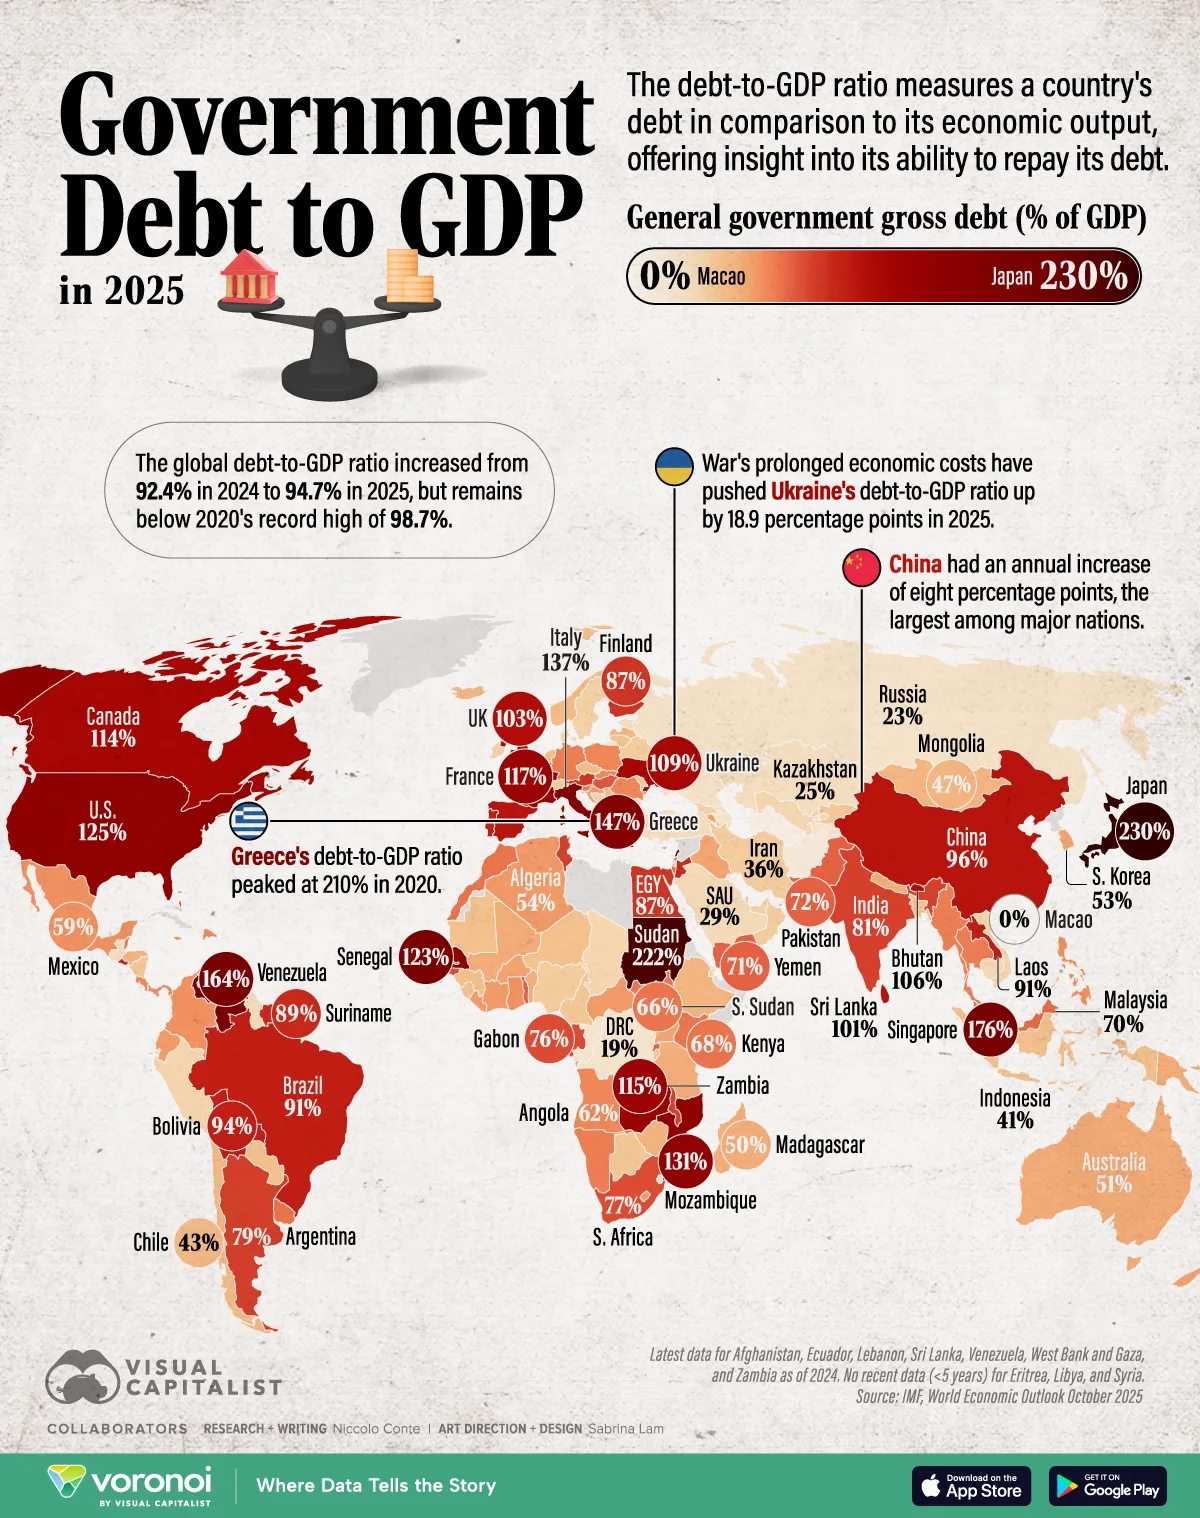
Mapped: Government Debt to GDP by Country in 2025
See visuals like this from many other data creators on our Voronoi app. Download it for free on iOS or Android and discover incredible data-driven charts from a variety of trusted sources.
Key Takeaways
- The global debt-to-GDP ratio rose 2.3 percentage points to 94.7% in 2025, but is still below the pandemic-era peak of 98.7% in 2020.
- Japan remains the world’s most indebted nation at 230% of GDP, followed by Sudan (222%) and Singapore (176%).
Global debt levels continue to rise, with 2025 marking another year of fiscal strain across both advanced and developing economies.
This map shows how much each country’s government debt compares to its economic output, measured as debt-to-GDP ratio, offering insight into fiscal resilience and vulnerability worldwide.
Data & Discussion
The data for this visualization comes from the latest update by the International Monetary Fund (IMF) to their World Economic Outlook as of October 2025.
It measures general government gross debt as a percentage of GDP across more than 190 countries for 2025, which are all in the data table below.
| Rank | Country | Debt to GDP (%, 2025) |
|---|---|---|
| 1 | Japan | 230% |
| 2 | Sudan | 222% |
| 3 | Singapore | 176% |
| 4 | Venezuela | 164% |
| 5 | Lebanon | 164% |
| 6 | Greece | 147% |
| 7 | Bahrain | 143% |
| 8 | Italy | 137% |
| 9 | Maldives | 132% |
| 10 | Mozambique | 131% |
| 11 | United States | 125% |
| 12 | Senegal | 123% |
| 13 | France | 117% |
| 14 | Zambia | 115% |
| 15 | Canada | 114% |
| 16 | Ukraine | 109% |
| 17 | Belgium | 108% |
| 18 | Cabo Verde | 106% |
| 19 | Bhutan | 106% |
| 20 | United Kingdom | 103% |
| 21 | Sri Lanka | 101% |
| 22 | Spain | 100% |
| 23 | Barbados | 100% |
| 24 | China | 96% |
| 25 | Dominica | 96% |
| 26 | Saint Vincent and the Grenadines | 94% |
| 27 | Bolivia | 94% |
| 28 | Republic of the Congo | 93% |
| 29 | Brazil | 91% |
| 30 | Portugal | 91% |
| 31 | Laos | 91% |
| 32 | Jordan | 90% |
| 33 | Suriname | 89% |
| 34 | Mauritius | 88% |
| 35 | El Salvador | 88% |
| 36 | Egypt | 87% |
| 37 | Finland | 87% |
| 38 | Austria | 82% |
| 39 | India | 81% |
| 40 | Tunisia | 81% |
| 41 | Malawi | 80% |
| 42 | Argentina | 79% |
| 43 | South Africa | 77% |
| 44 | Saint Lucia | 77% |
| 45 | Fiji | 77% |
| 46 | Gabon | 76% |
| 47 | Guinea-Bissau | 76% |
| 48 | Hungary | 75% |
| 49 | Gambia | 74% |
| 50 | Bahamas | 74% |
| 51 | Rwanda | 73% |
| 52 | Togo | 72% |
| 53 | Pakistan | 72% |
| 54 | Yemen | 71% |
| 55 | Malaysia | 70% |
| 56 | Israel | 69% |
| 57 | Kenya | 68% |
| 58 | Grenada | 68% |
| 59 | Morocco | 67% |
| 60 | Aruba | 67% |
| 61 | Slovenia | 67% |
| 62 | Uruguay | 67% |
| 63 | South Sudan | 66% |
| 64 | Antigua and Barbuda | 66% |
| 65 | West Bank and Gaza | 66% |
| 66 | Trinidad and Tobago | 65% |
| 67 | Thailand | 65% |
| 68 | Belize | 65% |
| 69 | Germany | 64% |
| 70 | Namibia | 64% |
| 71 | Myanmar | 64% |
| 72 | Palau | 63% |
| 73 | San Marino | 63% |
| 74 | Angola | 62% |
| 75 | Saint Kitts and Nevis | 62% |
| 76 | Romania | 61% |
| 77 | Montenegro | 61% |
| 78 | Dominican Republic | 60% |
| 79 | Poland | 60% |
| 80 | Costa Rica | 60% |
| 81 | Panama | 60% |
| 82 | Slovak Republic | 60% |
| 83 | Jamaica | 59% |
| 84 | Ghana | 59% |
| 85 | Colombia | 59% |
| 86 | Mexico | 59% |
| 87 | Philippines | 58% |
| 88 | Cyprus | 58% |
| 89 | Central African Republic | 57% |
| 90 | Lesotho | 57% |
| 91 | Croatia | 57% |
| 92 | Seychelles | 57% |
| 93 | Liberia | 56% |
| 94 | Côte d'Ivoire | 56% |
| 95 | Albania | 54% |
| 96 | Algeria | 54% |
| 97 | Ecuador | 54% |
| 98 | Armenia | 53% |
| 99 | South Korea | 53% |
| 100 | Burkina Faso | 53% |
| 101 | New Zealand | 53% |
| 102 | Iraq | 53% |
| 103 | North Macedonia | 53% |
| 104 | Uganda | 52% |
| 105 | São Tomé and Príncipe | 51% |
| 106 | Australia | 51% |
| 107 | Benin | 51% |
| 108 | Papua New Guinea | 50% |
| 109 | Madagascar | 50% |
| 110 | Tanzania | 50% |
| 111 | Nepal | 49% |
| 112 | Mali | 49% |
| 113 | Vanuatu | 49% |
| 114 | Iceland | 47% |
| 115 | Latvia | 47% |
| 116 | Malta | 47% |
| 117 | Ethiopia | 47% |
| 118 | Mongolia | 47% |
| 119 | Honduras | 45% |
| 120 | Zimbabwe | 45% |
| 121 | Czechia | 44% |
| 122 | Netherlands | 44% |
| 123 | Serbia | 44% |
| 124 | Eswatini | 43% |
| 125 | Chile | 43% |
| 126 | Norway | 43% |
| 127 | Guinea | 42% |
| 128 | Niger | 42% |
| 129 | Lithuania | 42% |
| 130 | Paraguay | 42% |
| 131 | Mauritania | 41% |
| 132 | Sierra Leone | 41% |
| 133 | Indonesia | 41% |
| 134 | Qatar | 41% |
| 135 | Bangladesh | 40% |
| 136 | Burundi | 40% |
| 137 | Nicaragua | 39% |
| 138 | Botswana | 39% |
| 139 | Cameroon | 38% |
| 140 | Kyrgyz Republic | 38% |
| 141 | Moldova | 38% |
| 142 | Switzerland | 37% |
| 143 | Equatorial Guinea | 37% |
| 144 | Nigeria | 36% |
| 145 | Belarus | 36% |
| 146 | Iran | 36% |
| 147 | Oman | 35% |
| 148 | Georgia | 34% |
| 149 | Sweden | 34% |
| 150 | United Arab Emirates | 34% |
| 151 | Ireland | 33% |
| 152 | Peru | 32% |
| 153 | Vietnam | 32% |
| 154 | Andorra | 32% |
| 155 | Tonga | 32% |
| 156 | Chad | 32% |
| 157 | Uzbekistan | 31% |
| 158 | Bosnia and Herzegovina | 31% |
| 159 | Djibouti | 31% |
| 160 | Comoros | 30% |
| 161 | Denmark | 30% |
| 162 | Saudi Arabia | 29% |
| 163 | Guyana | 29% |
| 164 | Bulgaria | 28% |
| 165 | Cambodia | 28% |
| 166 | Luxembourg | 27% |
| 167 | Guatemala | 27% |
| 168 | Kazakhstan | 25% |
| 169 | Estonia | 24% |
| 170 | Türkiye | 24% |
| 171 | Solomon Islands | 24% |
| 172 | Taiwan | 23% |
| 173 | Russian Federation | 23% |
| 174 | Azerbaijan | 22% |
| 175 | Tajikistan | 22% |
| 176 | Samoa | 21% |
| 177 | Democratic Republic of the Congo | 19% |
| 178 | Puerto Rico | 18% |
| 179 | Kosovo | 18% |
| 180 | Nauru | 15% |
| 181 | Timor-Leste | 14% |
| 182 | Haiti | 12% |
| 183 | Hong Kong | 12% |
| 184 | Marshall Islands | 11% |
| 185 | Micronesia | 9% |
| 186 | Afghanistan | 9% |
| 187 | Kiribati | 9% |
| 188 | Kuwait | 7% |
| 189 | Turkmenistan | 4% |
| 190 | Tuvalu | 4% |
| 191 | Brunei Darussalam | 2% |
| 192 | Liechtenstein | 1% |
| 193 | Macao | 0% |
The IMF estimates the global average debt-to-GDP ratio at 94.7%, up from 92.4% the previous year.
While debt growth has slowed from the COVID-19 surge and high of 98.7%, elevated borrowing costs and sluggish growth are keeping public debt levels high.
Countries with the Highest Debt to GDP in 2025
At the top of the list, Japan holds a staggering 230% debt-to-GDP ratio, reflecting decades of fiscal stimulus and aging demographics.
Sudan (222%) follows, burdened by years of economic instability and conflict.
Singapore (176%), though high on the list, uses debt differently—largely tied to investment through its sovereign wealth funds.
Other high-debt countries include Venezuela (164%), Lebanon (164%), and Greece (147%), whose debt-to-GDP ratio has fallen significantly from its peak of 210% in 2020.
Government Debt in Advanced and Emerging Economies
Among advanced economies, average government debt stands near 113% of GDP, led by countries such as Japan (230%), Italy (137%), and the United States (124%).
In contrast, emerging markets average around 74%, with large economies like China (84%) and India (81%) driving much of the increase in recent years.
While emerging economies generally maintain lower ratios, rising global interest rates have intensified fiscal challenges, especially for nations reliant on external borrowing.
Learn More on the Voronoi App
To learn more about the government debt of major nations, check out this graphic which shows the government debt-to-GDP ratio projections for G7 countries in 2029.