
See more visualizations like this on the Voronoi app.
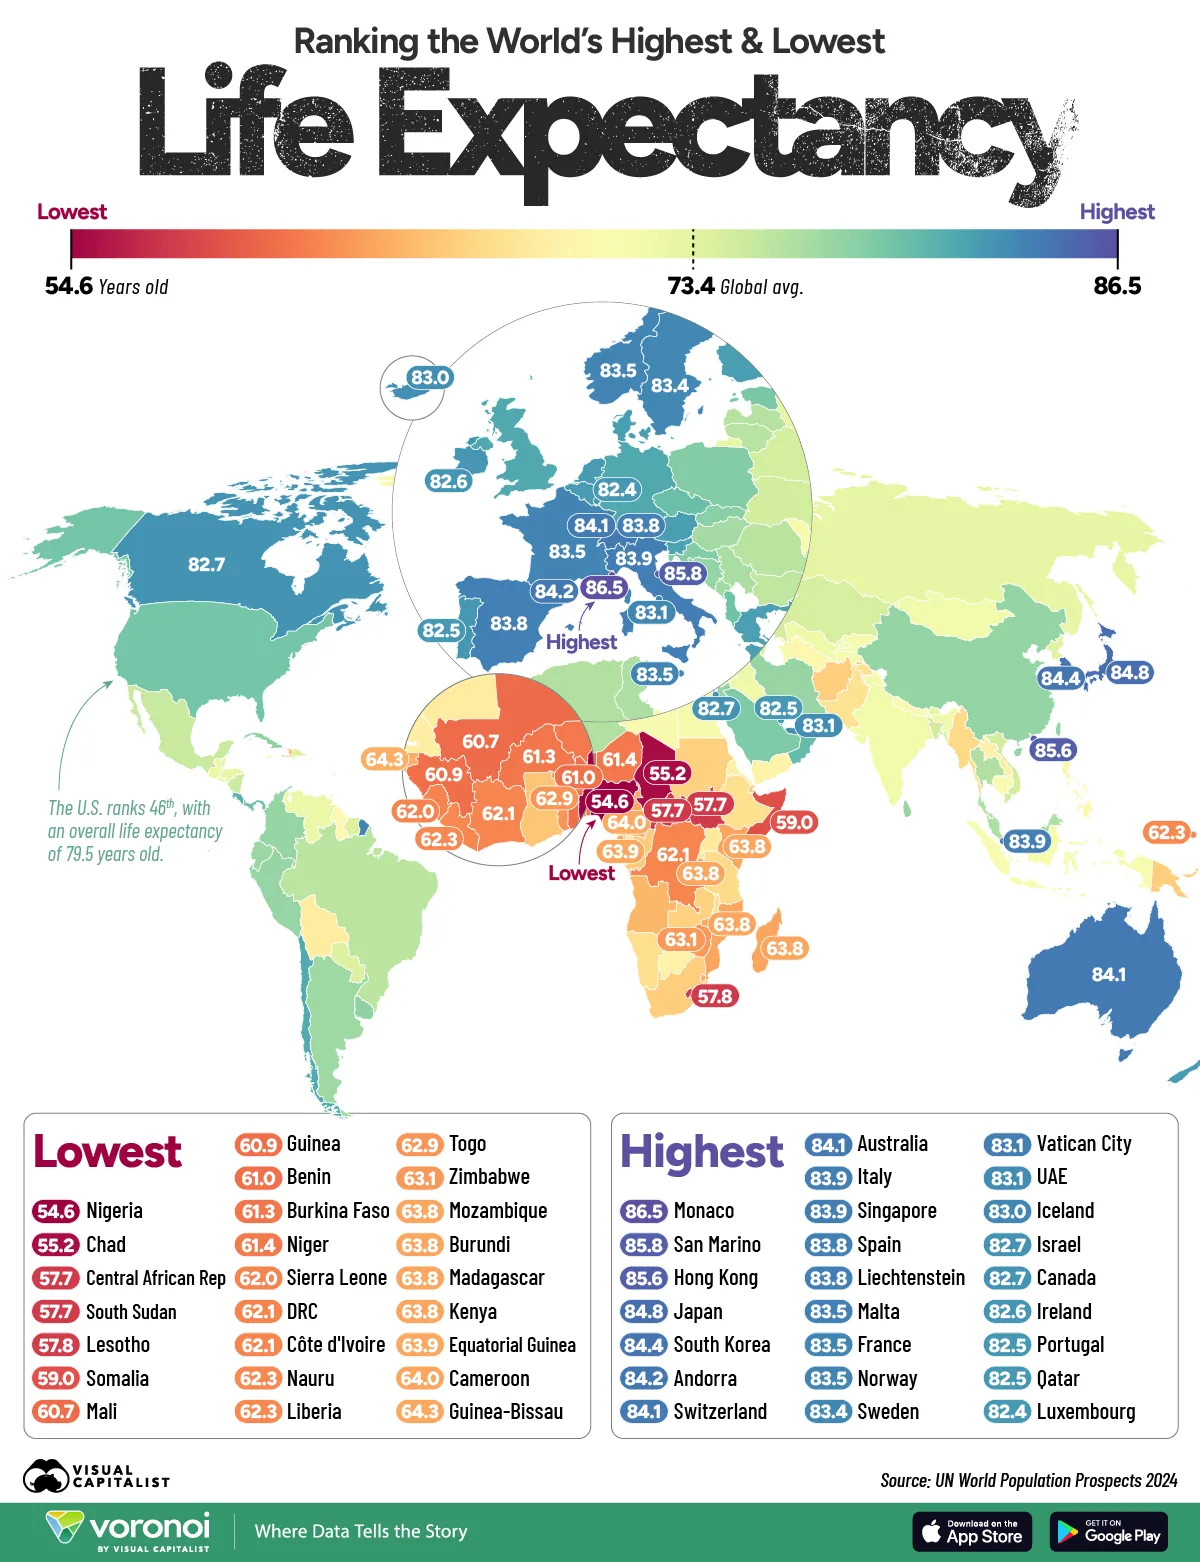
Mapped: Life Expectancy Around the World (2025)
This was originally posted on our Voronoi app. Download the app for free on iOS or Android and discover incredible data-driven charts from a variety of trusted sources.
Key Takeaways
- Monaco has the world’s highest life expectancy at 86.5 years.
- Nigeria and Chad sit at the bottom of the global ranking, with averages below 56 years.
- Women outlive men in every country, with an average gap of five years globally.
How long people live depends on far more than genetics, with access to healthcare, diet, infrastructure, and income levels all playing a role in shaping a nation’s life expectancy.
This infographic uses data from the United Nations to visualize average life expectancy around the world in 2025 across both sexes.
Where Do People Live the Longest?
At the top of the list are small, wealthy nations and developed economies in East Asia and Europe, while developing nations in Sub-Saharan Africa make up the bottom of the list. Globally, the average life expectancy is 73.4 years.
| Country | Life expectancy, both sexes | Life expectancy, female | Life expectancy, male |
|---|---|---|---|
| Monaco | 86.5 | 88.6 | 84.6 |
| San Marino | 85.8 | 87.2 | 84.3 |
| Hong Kong | 85.6 | 88.3 | 83.0 |
| Japan | 84.8 | 87.9 | 81.8 |
| South Korea | 84.4 | 87.3 | 81.3 |
| Andorra | 84.2 | 86.2 | 82.3 |
| Australia | 84.1 | 85.5 | 82.3 |
| Switzerland | 84.1 | 86.0 | 82.2 |
| Italy | 83.9 | 85.9 | 81.8 |
| Singapore | 83.9 | 86.4 | 81.4 |
| Liechtenstein | 83.8 | 85.4 | 82.0 |
| Spain | 83.8 | 86.4 | 81.1 |
| Norway | 83.5 | 85.0 | 81.9 |
| Malta | 83.5 | 85.4 | 81.5 |
| France | 83.5 | 86.2 | 80.6 |
| Sweden | 83.4 | 85.2 | 81.7 |
| United Arab Emirates | 83.1 | 84.3 | 82.2 |
| Vatican City | 83.1 | 85.2 | 81.0 |
| Iceland | 83.0 | 84.5 | 81.6 |
| Israel | 82.7 | 84.7 | 80.7 |
| Canada | 82.7 | 84.9 | 80.5 |
| Ireland | 82.6 | 84.6 | 80.6 |
| Qatar | 82.5 | 83.5 | 81.8 |
| Portugal | 82.5 | 85.3 | 79.7 |
| Luxembourg | 82.4 | 83.9 | 80.8 |
| Netherlands | 82.3 | 83.8 | 80.7 |
| Belgium | 82.3 | 84.5 | 80.1 |
| New Zealand | 82.2 | 83.9 | 80.6 |
| Denmark | 82.1 | 84.0 | 80.2 |
| Austria | 82.1 | 84.5 | 79.8 |
| Finland | 82.1 | 84.8 | 79.4 |
| Greece | 82.0 | 84.5 | 79.5 |
| Cyprus | 81.8 | 83.8 | 79.8 |
| Slovenia | 81.8 | 84.5 | 79.1 |
| United Kingdom | 81.5 | 83.3 | 79.5 |
| Germany | 81.5 | 83.9 | 79.2 |
| Bahrain | 81.4 | 82.1 | 80.8 |
| Chile | 81.4 | 83.2 | 79.5 |
| Maldives | 81.3 | 83.0 | 80.0 |
| Costa Rica | 81.0 | 83.6 | 78.4 |
| Kuwait | 80.6 | 82.0 | 79.5 |
| Oman | 80.3 | 82.0 | 78.7 |
| Czech Republic | 80.0 | 82.8 | 77.2 |
| Albania | 79.8 | 81.6 | 77.9 |
| Panama | 79.8 | 82.7 | 76.9 |
| United States | 79.5 | 82.0 | 77.0 |
| Estonia | 79.3 | 83.2 | 75.1 |
| Saudi Arabia | 79.0 | 81.3 | 77.3 |
| Croatia | 78.8 | 81.8 | 75.6 |
| Poland | 78.8 | 82.5 | 75.1 |
| Slovakia | 78.5 | 81.7 | 75.2 |
| Cuba | 78.3 | 80.7 | 75.9 |
| Uruguay | 78.3 | 82.0 | 74.4 |
| Lebanon | 78.0 | 79.9 | 75.9 |
| Jordan | 78.0 | 80.3 | 75.9 |
| China | 78.0 | 81.0 | 75.3 |
| Bosnia and Herzegovina | 78.0 | 81.1 | 74.7 |
| Peru | 77.9 | 80.3 | 75.6 |
| Colombia | 77.9 | 80.6 | 75.2 |
| Iran | 77.8 | 79.8 | 76.0 |
| Antigua and Barbuda | 77.8 | 80.5 | 74.7 |
| Sri Lanka | 77.7 | 80.8 | 74.5 |
| Ecuador | 77.6 | 80.3 | 74.9 |
| North Macedonia | 77.5 | 79.7 | 75.3 |
| Argentina | 77.5 | 80.0 | 75.0 |
| Turkey | 77.4 | 80.3 | 74.6 |
| Montenegro | 77.3 | 80.5 | 73.9 |
| Hungary | 77.2 | 80.3 | 73.9 |
| Serbia | 76.9 | 80.2 | 73.7 |
| Malaysia | 76.8 | 79.5 | 74.5 |
| Tunisia | 76.7 | 79.3 | 74.1 |
| Thailand | 76.6 | 81.0 | 72.3 |
| Algeria | 76.5 | 77.9 | 75.1 |
| Barbados | 76.3 | 78.8 | 73.8 |
| Latvia | 76.3 | 80.6 | 71.8 |
| Cape Verde | 76.2 | 79.4 | 73.0 |
| Lithuania | 76.2 | 80.8 | 71.4 |
| Romania | 76.1 | 79.7 | 72.6 |
| Brazil | 76.0 | 79.2 | 73.0 |
| Bulgaria | 75.8 | 79.4 | 72.3 |
| Armenia | 75.8 | 79.6 | 71.6 |
| Brunei | 75.5 | 77.7 | 73.5 |
| Morocco | 75.5 | 77.8 | 73.3 |
| Grenada | 75.4 | 78.5 | 72.5 |
| Mexico | 75.3 | 78.0 | 72.4 |
| Nicaragua | 75.1 | 77.6 | 72.5 |
| Mauritius | 75.1 | 78.3 | 72.1 |
| Bangladesh | 74.9 | 76.7 | 73.3 |
| Bahamas | 74.7 | 78.3 | 71.1 |
| Vietnam | 74.7 | 79.4 | 70.0 |
| Georgia | 74.7 | 79.2 | 69.8 |
| Ukraine | 74.7 | 79.4 | 69.8 |
| Azerbaijan | 74.6 | 77.3 | 71.7 |
| Belarus | 74.6 | 79.2 | 69.7 |
| Kazakhstan | 74.5 | 78.5 | 70.3 |
| Paraguay | 74.0 | 77.1 | 71.0 |
| Dominican Republic | 73.9 | 77.1 | 70.7 |
| Suriname | 73.8 | 77.0 | 70.6 |
| North Korea | 73.7 | 75.9 | 71.5 |
| Belize | 73.7 | 76.7 | 71.1 |
| Trinidad and Tobago | 73.6 | 76.8 | 70.5 |
| Bhutan | 73.3 | 75.3 | 71.6 |
| Russia | 73.3 | 79.2 | 67.5 |
| Tonga | 73.1 | 76.5 | 69.5 |
| Honduras | 73.0 | 75.7 | 70.5 |
| Seychelles | 73.0 | 76.7 | 70.1 |
| Guatemala | 72.8 | 75.0 | 70.4 |
| Saint Lucia | 72.8 | 76.5 | 69.5 |
| Venezuela | 72.7 | 76.7 | 68.9 |
| Syria | 72.6 | 74.9 | 70.2 |
| Uzbekistan | 72.5 | 75.5 | 69.6 |
| Iraq | 72.4 | 74.2 | 70.5 |
| Saint Kitts and Nevis | 72.3 | 76.2 | 68.7 |
| El Salvador | 72.3 | 76.5 | 67.8 |
| India | 72.2 | 73.9 | 70.7 |
| Mongolia | 72.0 | 76.7 | 67.5 |
| Tajikistan | 71.9 | 74.1 | 69.7 |
| Samoa | 71.8 | 73.8 | 70.0 |
| Egypt | 71.8 | 74.0 | 69.7 |
| Kyrgyzstan | 71.8 | 75.4 | 68.3 |
| Vanuatu | 71.7 | 74.1 | 69.6 |
| Jamaica | 71.6 | 74.2 | 69.1 |
| Saint Vincent and the Grenadines | 71.4 | 74.5 | 68.8 |
| Indonesia | 71.3 | 73.4 | 69.2 |
| Dominica | 71.3 | 74.7 | 68.3 |
| Moldova | 71.3 | 75.7 | 66.7 |
| Libya | 71.1 | 72.7 | 69.6 |
| Cambodia | 70.8 | 73.4 | 68.2 |
| Solomon Islands | 70.7 | 72.2 | 69.4 |
| Nepal | 70.6 | 72.1 | 69.1 |
| Guyana | 70.3 | 74.1 | 66.6 |
| Greenland | 70.2 | 72.6 | 68.2 |
| Turkmenistan | 70.2 | 73.0 | 67.0 |
| Philippines | 70.0 | 73.0 | 67.0 |
| Sao Tome and Principe | 69.9 | 73.9 | 66.4 |
| Yemen | 69.4 | 71.5 | 67.4 |
| Palau | 69.4 | 71.9 | 67.3 |
| Botswana | 69.3 | 71.8 | 66.8 |
| Laos | 69.2 | 71.5 | 67.0 |
| Palestine | 69.2 | 74.3 | 65.2 |
| Senegal | 68.9 | 71.0 | 67.0 |
| Eritrea | 68.9 | 70.9 | 66.8 |
| Mauritania | 68.7 | 70.7 | 66.7 |
| Bolivia | 68.7 | 71.3 | 66.3 |
| Gabon | 68.5 | 71.2 | 66.1 |
| Uganda | 68.5 | 71.4 | 65.5 |
| Rwanda | 68.0 | 70.1 | 65.7 |
| Timor-Leste | 67.9 | 69.7 | 66.3 |
| Pakistan | 67.8 | 70.3 | 65.5 |
| Malawi | 67.6 | 70.8 | 64.3 |
| Ethiopia | 67.6 | 71.0 | 64.3 |
| Fiji | 67.5 | 69.5 | 65.5 |
| Namibia | 67.5 | 71.5 | 63.5 |
| Micronesia | 67.4 | 71.3 | 63.6 |
| Tuvalu | 67.3 | 70.9 | 63.9 |
| Tanzania | 67.2 | 70.0 | 64.4 |
| Marshall Islands | 67.1 | 69.5 | 65.0 |
| Myanmar | 67.1 | 70.4 | 64.0 |
| Comoros | 67.0 | 69.2 | 65.0 |
| Kiribati | 66.6 | 68.3 | 64.7 |
| Zambia | 66.5 | 68.9 | 64.1 |
| Sudan | 66.5 | 69.8 | 63.5 |
| Afghanistan | 66.3 | 67.8 | 64.7 |
| Papua New Guinea | 66.3 | 69.2 | 63.8 |
| South Africa | 66.3 | 69.8 | 62.8 |
| Djibouti | 66.2 | 68.7 | 63.7 |
| Gambia | 66.1 | 67.8 | 64.3 |
| Republic of the Congo | 66.0 | 67.7 | 64.3 |
| Ghana | 65.7 | 68.2 | 63.3 |
| Haiti | 65.1 | 68.5 | 61.9 |
| Angola | 64.8 | 67.3 | 62.3 |
| Guinea-Bissau | 64.3 | 66.5 | 61.8 |
| Eswatini | 64.3 | 67.1 | 61.3 |
| Cameroon | 64.0 | 66.2 | 61.8 |
| Equatorial Guinea | 63.9 | 65.9 | 62.2 |
| Madagascar | 63.8 | 65.6 | 62.1 |
| Burundi | 63.8 | 65.9 | 61.8 |
| Kenya | 63.8 | 66.1 | 61.6 |
| Mozambique | 63.8 | 66.7 | 60.5 |
| Zimbabwe | 63.1 | 65.3 | 60.5 |
| Togo | 62.9 | 63.1 | 62.7 |
| Liberia | 62.3 | 63.6 | 61.0 |
| Nauru | 62.3 | 64.2 | 60.4 |
| Ivory Coast | 62.1 | 64.3 | 60.2 |
| DR Congo | 62.1 | 64.2 | 60.0 |
| Sierra Leone | 62.0 | 63.7 | 60.2 |
| Niger | 61.4 | 62.4 | 60.5 |
| Burkina Faso | 61.3 | 63.4 | 59.1 |
| Benin | 61.0 | 62.4 | 59.5 |
| Guinea | 60.9 | 62.1 | 59.7 |
| Mali | 60.7 | 62.1 | 59.3 |
| Somalia | 59.0 | 61.5 | 56.5 |
| Lesotho | 57.8 | 60.4 | 55.0 |
| Central African Republic | 57.7 | 59.6 | 55.5 |
| South Sudan | 57.7 | 60.8 | 54.8 |
| Chad | 55.2 | 57.2 | 53.4 |
| Nigeria | 54.6 | 54.9 | 54.3 |
Residents of Monaco live an average of 86.5 years—the highest in the world—followed closely by San Marino (85.8), Hong Kong (85.6), and Japan (84.8). Most of these countries and territories combine universal healthcare, low crime, and strong social safety nets with diets rich in seafood and low in processed foods.
Among major economies, Australia (84.1), South Korea (84.4), and Italy (83.9) lead globally, while the United States lags behind at 79.5 years, ranking outside the top 40.
Across all countries, women live longer than men—by an average of five years globally. In Russia, the gap reaches nearly 12 years, wider than any other country.
Where Life Expectancy Is Lowest
At the other end of the scale, life expectancy in parts of Sub-Saharan Africa remains under 60 years. Nigeria ranks lowest with the average person expected to live 54.6 years, followed by Chad (55.2), and the Central African Republic (57.7) rank among the world’s lowest.
Many of these countries face ongoing challenges—limited access to healthcare, malnutrition, and high infant mortality.
The Global Longevity Divide
Globally, life expectancy continues to climb, but the gap between the longest- and shortest-living populations remains wide, with over 30 years between Monaco and Nigeria.
As developing economies invest in healthcare and education, that gap could narrow. In rich nations, however, lifestyle-related diseases such as heart disease and diabetes pose challenges to further gains in longevity.
Learn More on the Voronoi App
If you enjoyed today’s post, check out The World’s Aging Population on Voronoi, the new app from Visual Capitalist.