![]()
See this visualization first on the Voronoi app.
Use This Visualization
Mapped: Poverty Rates by U.S State
This was originally posted on our Voronoi app. Download the app for free on iOS or Android and discover incredible data-driven charts from a variety of trusted sources.
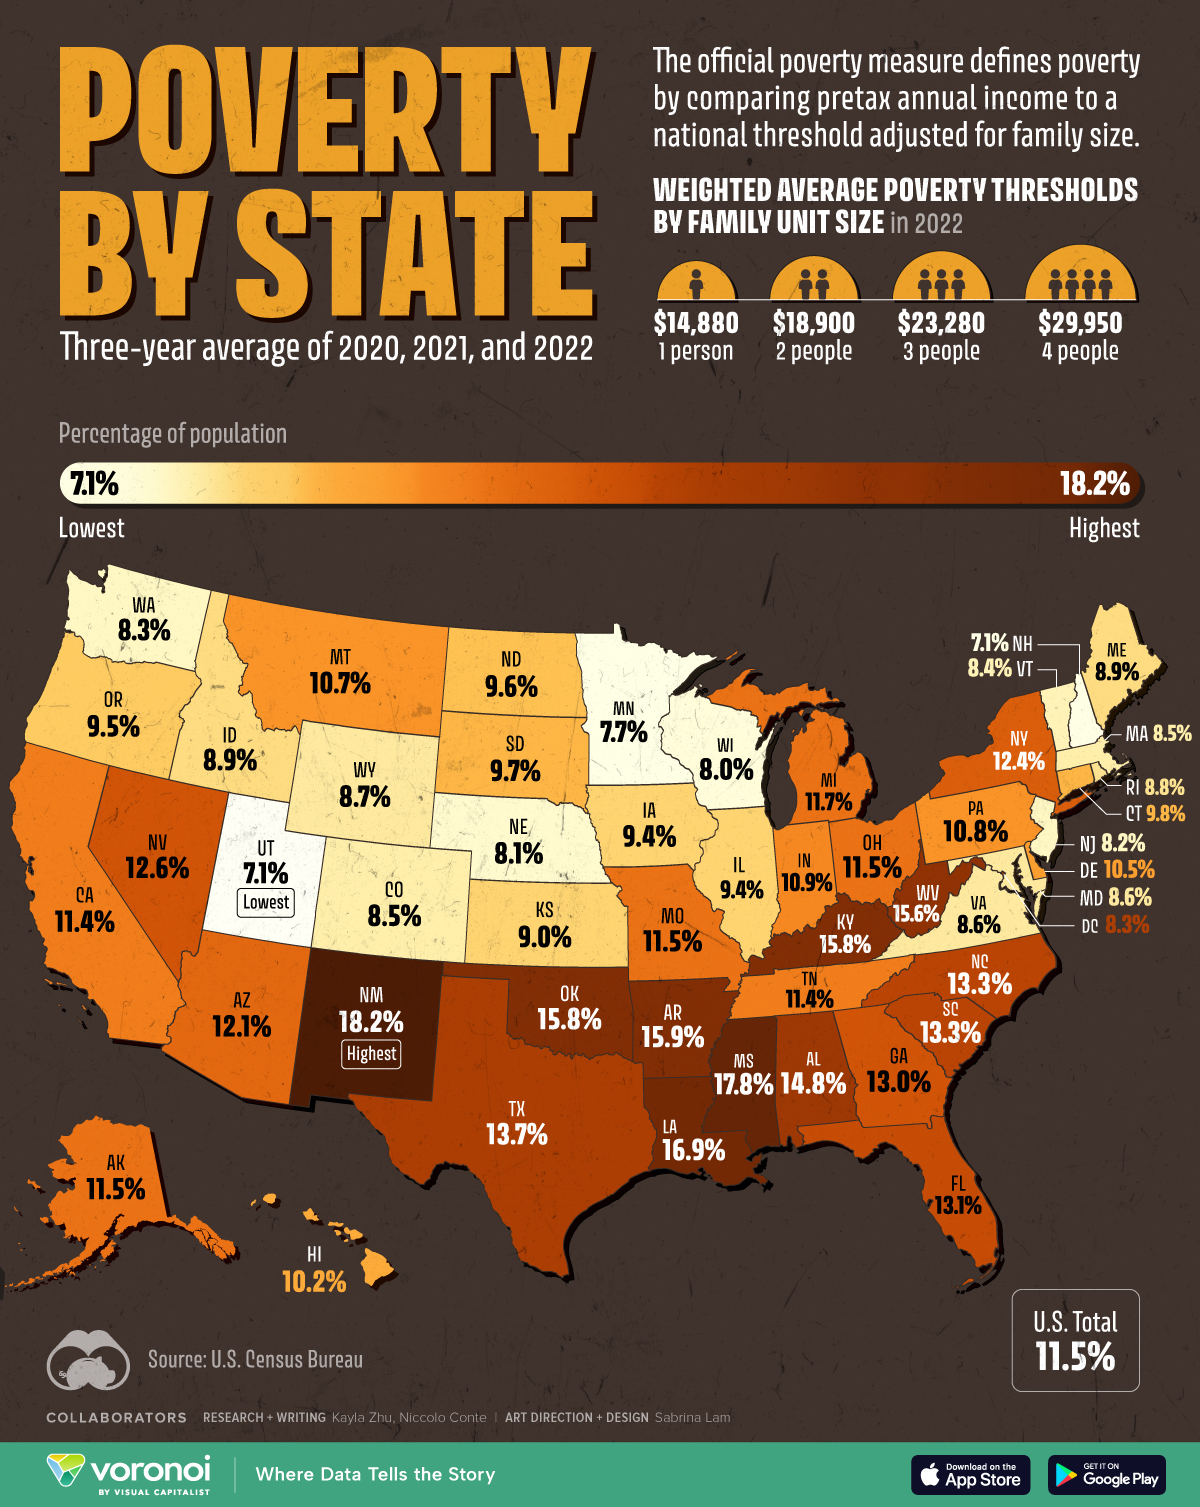
In 2022, the U.S. official poverty rate was 11.5% with a total of 37.9 million people in poverty. This map visualizes the three-year average of poverty rates by U.S. state from 2020 to 2022.
The poverty rates are calculated using the official poverty measure, which defines poverty by comparing the pre-tax annual income to a specific national threshold adjusted for family size.
The figures come from the U.S. Census Bureau and are updated as of September 2023.
Southern U.S. Generally More Poor
U.S. poverty rates were relatively higher in the South.
Many of the states with the highest poverty rates, including New Mexico (18.2%), Mississippi (17.8%), Louisiana (16.9%), Arkansas (15.9%), and Kentucky (15.8%), are characterized by large rural areas which are historically poorer than urban areas.
| State | Number of people in poverty (in thousands) | Percentage of population in poverty |
|---|---|---|
| New Mexico | 382 | 18.2% |
| Mississippi | 518 | 17.8% |
| Louisiana | 765 | 16.9% |
| Arkansas | 475 | 15.9% |
| Kentucky | 706 | 15.8% |
| Oklahoma | 620 | 15.8% |
| West Virginia | 274 | 15.6% |
| Alabama | 738 | 14.8% |
| District of Columbia | 98 | 14.7% |
| Texas | 4,026 | 13.7% |
| North Carolina | 1,407 | 13.3% |
| South Carolina | 693 | 13.3% |
| Florida | 2,861 | 13.1% |
| Georgia | 1,391 | 13.0% |
| Nevada | 394 | 12.6% |
| New York | 2,410 | 12.4% |
| Arizona | 876 | 12.1% |
| Michigan | 1,156 | 11.7% |
| Alaska | 81 | 11.5% |
| Missouri | 695 | 11.5% |
| Ohio | 1,345 | 11.5% |
| California | 4,439 | 11.4% |
| Tennessee | 796 | 11.4% |
| Indiana | 739 | 10.9% |
| Pennsylvania | 1,368 | 10.8% |
| Montana | 118 | 10.7% |
| Delaware | 106 | 10.5% |
| Hawaii | 146 | 10.2% |
| Connecticut | 350 | 9.8% |
| South Dakota | 86 | 9.7% |
| North Dakota | 73 | 9.6% |
| Oregon | 399 | 9.5% |
| Illinois | 1,174 | 9.4% |
| Iowa | 299 | 9.4% |
| Kansas | 260 | 9.0% |
| Idaho | 170 | 8.9% |
| Maine | 122 | 8.9% |
| Rhode Island | 95 | 8.8% |
| Wyoming | 49 | 8.7% |
| Maryland | 529 | 8.6% |
| Virginia | 733 | 8.6% |
| Colorado | 489 | 8.5% |
| Massachusetts | 589 | 8.5% |
| Vermont | 53 | 8.4% |
| Washington | 637 | 8.3% |
| New Jersey | 749 | 8.2% |
| Nebraska | 159 | 8.1% |
| Wisconsin | 467 | 8.0% |
| Minnesota | 429 | 7.7% |
| New Hampshire | 99 | 7.1% |
| Utah | 235 | 7.1% |
Many of these Southern states also have low levels of education attainment and labor force participation, which contribute to slow economic growth and lower personal income levels.
Nine of the 15 states with the lowest per-worker GDP are in the South, and states like Kentucky and Arkansas are among the states with the lowest prime-age employment-to-population ratio.
On the county level, about one in five counties in the South experienced “persistent poverty,” maintaining a poverty rate above 20% for three decades. Over 80% of all persistently poor counties in the U.S. are located in the South.
Learn More on the Voronoi App ![]()
To explore the broader social challenges faced by different states, including issues that often correlate with poverty, check out this map of violent crime rates by U.S. state.
The post Mapped: Poverty Rates by U.S State appeared first on Visual Capitalist.