![]()
See this visualization first on the Voronoi app.
Use This Visualization
Union Membership by State in the U.S.
This was originally posted on our Voronoi app. Download the app for free on iOS or Android and discover incredible data-driven charts from a variety of trusted sources.
Union membership in the United States can look quite different depending on where someone lives and what kind of job they have.
Local government workers, such as civic employees and police officers, are some of the most unionized professions. The union membership rate of public sector workers (32.5%) was more than five times higher than the rate of private-sector workers (6%) in 2023.
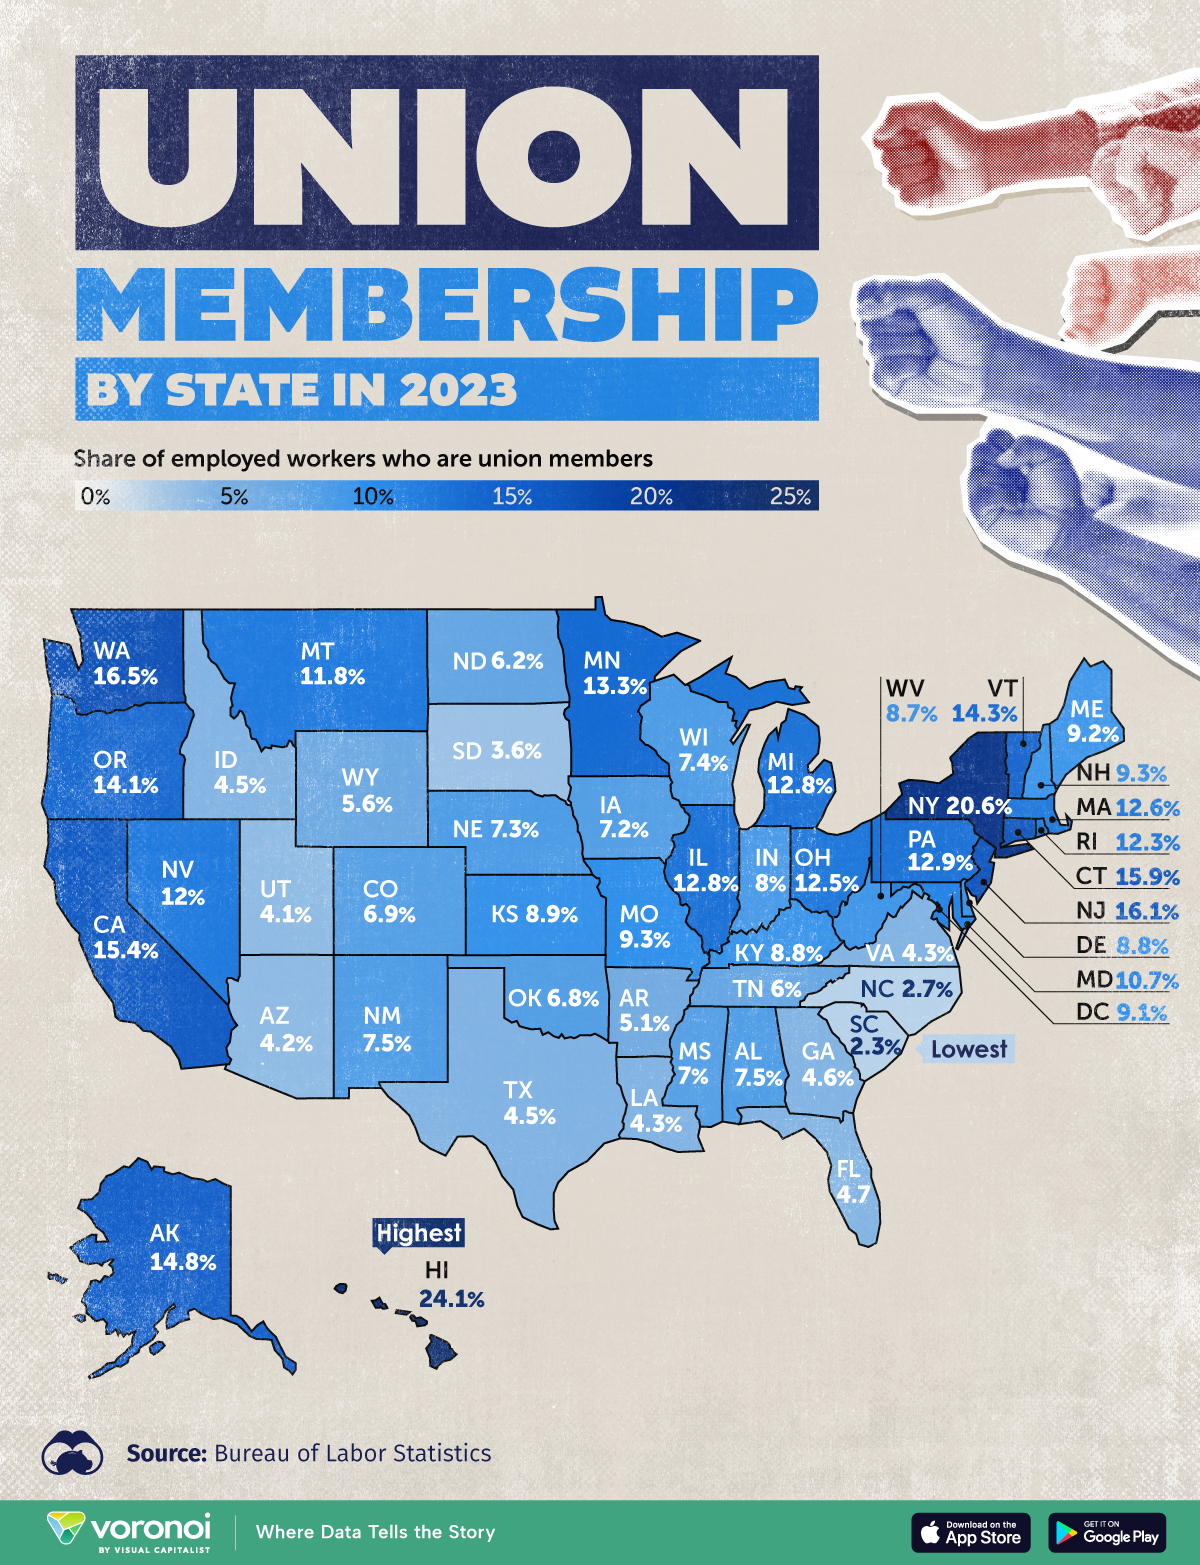
Union membership varies significantly by geographic area as well, with this map showing the rates of union membership by U.S. state in 2023.
The figures include wage and salary workers, and come from the U.S. Bureau of Labor Statistics, updated as of January 2024.
Hawaii Has Highest Rate of Union Membership
The island state of Hawaii saw the highest rates of union memberships in 2023, with almost a quarter (24.1%) of employees being members of a union.
States with the highest rates of union membership, including Hawaii, New York (20.6%), and Washington (16.5%), have strong histories in unions and relatively strong labor laws that support union organizing.
| State | Percentage of U.S. employed workers who are union members in 2023 |
|---|---|
| Hawaii | 24.1% |
| New York | 20.6% |
| Washington | 16.5% |
| New Jersey | 16.1% |
| Connecticut | 15.9% |
| California | 15.4% |
| Alaska | 14.8% |
| Vermont | 14.3% |
| Oregon | 14.1% |
| Minnesota | 13.3% |
| Pennsylvania | 12.9% |
| Illinois | 12.8% |
| Michigan | 12.8% |
| Massachusetts | 12.6% |
| Ohio | 12.5% |
| Nevada | 12.0% |
| Rhode Island | 12.3% |
| Montana | 11.8% |
| Maryland | 10.7% |
| Missouri | 9.3% |
| New Hampshire | 9.3% |
| Maine | 9.2% |
| District of Columbia | 9.1% |
| Kansas | 8.9% |
| Delaware | 8.8% |
| Kentucky | 8.8% |
| West Virginia | 8.7% |
| Indiana | 8.0% |
| Alabama | 7.5% |
| New Mexico | 7.5% |
| Wisconsin | 7.4% |
| Nebraska | 7.3% |
| Iowa | 7.2% |
| Mississippi | 7.0% |
| Colorado | 6.9% |
| Oklahoma | 6.8% |
| North Dakota | 6.2% |
| Tennessee | 6.0% |
| Wyoming | 5.6% |
| Arkansas | 5.1% |
| Florida | 4.7% |
| Georgia | 4.6% |
| Idaho | 4.5% |
| Texas | 4.5% |
| Louisiana | 4.3% |
| Virginia | 4.3% |
| Arizona | 4.2% |
| Utah | 4.1% |
| South Dakota | 3.6% |
| North Carolina | 2.7% |
| South Carolina | 2.3% |
On the other hand, the 15 states with the lowest rates of union membership, including South Carolina (2.3%) and North Carolina (2.7%) all have right-to-work laws, which prohibit agreements between employers and unions that require workers to pay union dues as a condition of employment.
Nationwide, 14.4 million wage and salary workers were union members in 2023, showing little change from 2022 (14.4 million).
Overall, the proportion of American workers who are union members has declined significantly in recent decades, dropping from 20.1% in 1983 to just 10% in 2023.
The post Mapped: Union Membership Rates by U.S. State in 2023 appeared first on Visual Capitalist.