![]()
See this visualization first on the Voronoi app.
Use This Visualization
Mapping Obesity Rates in the United States
This was originally posted on our Voronoi app. Download the app for free on iOS or Android and discover incredible data-driven charts from a variety of trusted sources.
Global adult obesity rates have steadily increased in the past few decades, more than tripling from 5% to 16% from 1990 to 2022.
With a much higher average obesity rate of 34%, the U.S. does see variance in its overweight population across regions and states. Lifestyle, dietary habits, socioeconomic status, access to healthcare, and physical activity levels all contribute to these regional differences.
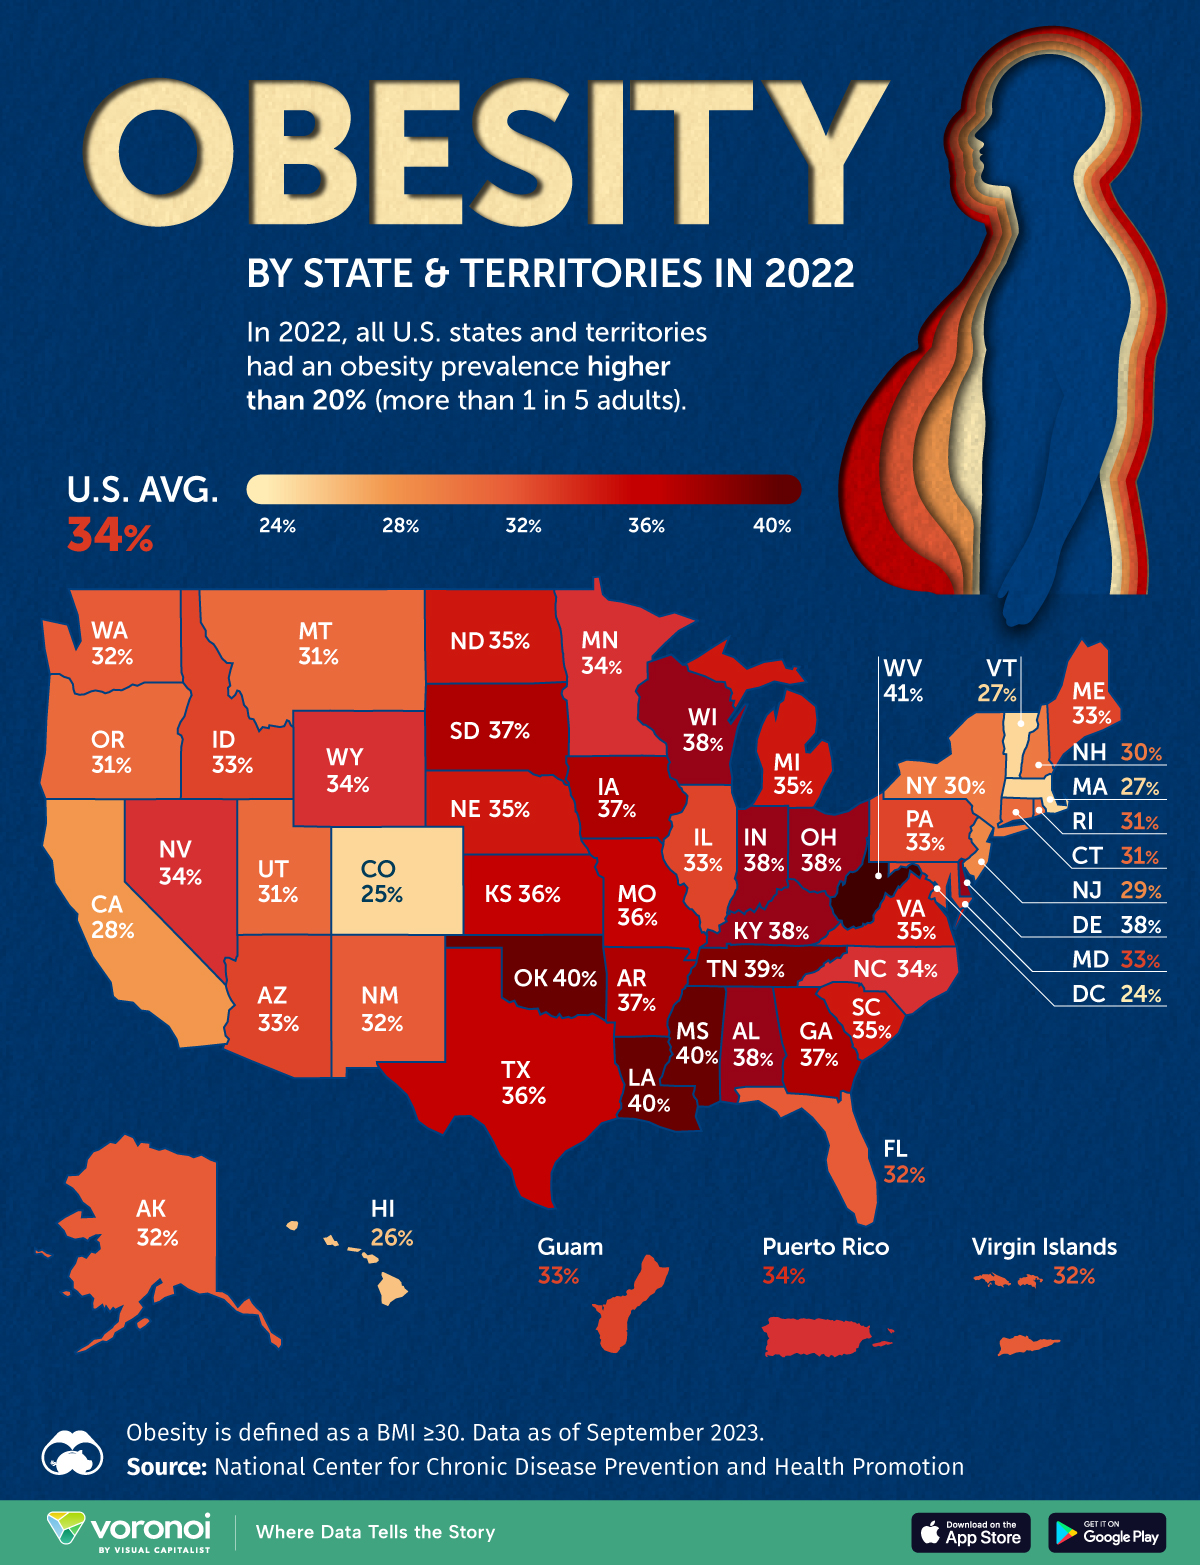
This map shows obesity rates in 2022 in each U.S. state and territory. Obesity is defined as having a body mass index (BMI) equal to or greater than 30.
The figures come from the U.S. Centers for Disease Control and Prevention (CDC) and are updated as of September 2023. Obesity figures are based on self-reported height and weight.
Midwest and South Have Highest Obesity Rates
In 2022, every U.S. state and territory had an obesity rate of over 20%, meaning more than one in five adults in the U.S. was obese.
Overall, the Midwest (35.8%) and South (35.6%) regions had the highest rates, followed by the Northeast (30.5%) and West (29.5%)
| State/Territory | Adult obesity rate in 2022 |
|---|---|
| West Virginia | 41.0% |
| Louisiana | 40.1% |
| Oklahoma | 40.0% |
| Mississippi | 39.5% |
| Tennessee | 38.9% |
| Alabama | 38.3% |
| Ohio | 38.1% |
| Delaware | 37.9% |
| Indiana | 37.7% |
| Kentucky | 37.7% |
| Wisconsin | 37.7% |
| Arkansas | 37.4% |
| Iowa | 37.4% |
| Georgia | 37.0% |
| South Dakota | 36.8% |
| Missouri | 36.4% |
| Kansas | 35.7% |
| Texas | 35.5% |
| North Dakota | 35.4% |
| Nebraska | 35.3% |
| Virginia | 35.2% |
| South Carolina | 35.0% |
| Michigan | 34.5% |
| Wyoming | 34.3% |
| North Carolina | 34.1% |
| Puerto Rico | 34.1% |
| Minnesota | 33.6% |
| Nevada | 33.5% |
| Illinois | 33.4% |
| Pennsylvania | 33.4% |
| Arizona | 33.2% |
| Idaho | 33.2% |
| Maryland | 33.2% |
| Maine | 33.1% |
| Guam | 32.7% |
| New Mexico | 32.4% |
| Alaska | 32.1% |
| Virgin Islands | 32.1% |
| Washington | 31.7% |
| Florida | 31.6% |
| Utah | 31.1% |
| Oregon | 30.9% |
| Rhode Island | 30.8% |
| Connecticut | 30.6% |
| Montana | 30.5% |
| New Hampshire | 30.2% |
| New York | 30.1% |
| New Jersey | 29.1% |
| California | 28.1% |
| Massachusetts | 27.2% |
| Vermont | 26.8% |
| Hawaii | 25.9% |
| Colorado | 25.0% |
| District of Columbia | 24.3% |
West Virginia recorded the highest obesity rate in the United States at 41%, followed by Louisiana and Oklahoma at 40%.
These states, characterized by high rural populations and poverty rates, are often home to many food deserts, or areas where access to fresh and healthy foods is limited, leading residents to rely more on fast food and other nutritionally poor options.
The CDC data also showed disparities in age and education level when it came to obesity prevalence.
According to the CDC, young adults were half as likely to be obese compared to middle-aged adults. Adults aged 18–24 years had the lowest prevalence of obesity (20.5%) while adults aged 45–54 years had the highest (39.9%).
Adults without a high school diploma were the most likely to be obese (37.6%) compared to 35.9% of adults with some college education, and 27.2% of college graduates.
Learn More on the Voronoi App ![]()
To see how the United States ranks among the countries that have the highest obesity rates in the world, check out this graphic.
The post Mapped: U.S. Obesity Rates, by State appeared first on Visual Capitalist.