![]()
See this visualization first on the Voronoi app.
Use This Visualization
Voter Turnout By State in the 2020 U.S. Presidential Election
This was originally posted on our Voronoi app. Download the app for free on iOS or Android and discover incredible data-driven charts from a variety of trusted sources.
With polls showing an extremely close race between Trump and Harris, presidential candidates are going all in on their final-month campaigning, knowing that voter turnout in swing states especially could determine the next president.
As the November presidential election draws nearer, it can be informative to look back on past voter turnout trends.
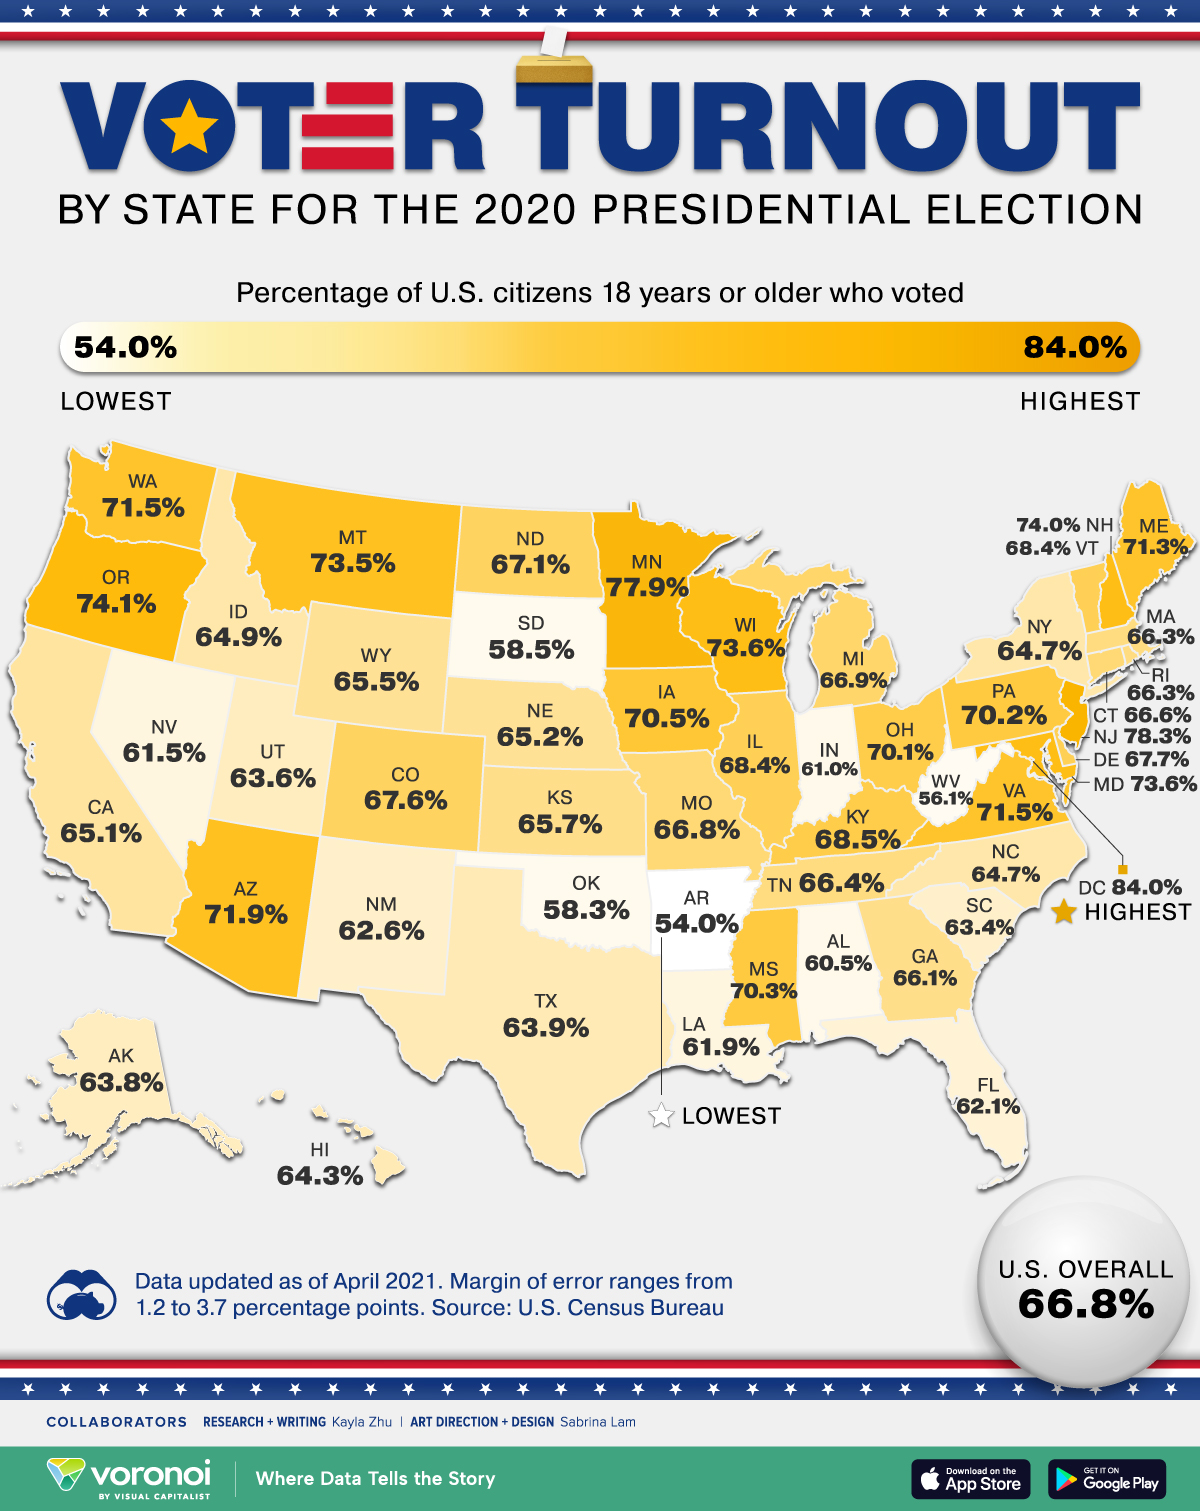
This map visualizes the voter turnout in the 2020 U.S. presidential election by state, with turnout figures representing the share of U.S. citizens age 18 or older who voted.
The data comes from the U.S. Census Bureau and was published in April 2021, with the margin of error ranging from 1.2 to 3.7 percentage points across all states.
2020 Election Saw Record High Turnout
Below, we show the voter turnout figures by state for the 2020 U.S. presidential election.
| State | 2020 U.S. Presidential Election Voter Turnout |
|---|---|
| District of Columbia | 84.0 |
| New Jersey | 78.3 |
| Minnesota | 77.9 |
| Oregon | 74.1 |
| New Hampshire | 74.0 |
| Wisconsin | 73.6 |
| Maryland | 73.6 |
| Montana | 73.5 |
| Arizona | 71.9 |
| Washington | 71.5 |
| Virginia | 71.5 |
| Maine | 71.3 |
| Iowa | 70.5 |
| Mississippi | 70.3 |
| Pennsylvania | 70.2 |
| Ohio | 70.1 |
| Kentucky | 68.5 |
| Vermont | 68.4 |
| Illinois | 68.4 |
| Delaware | 67.7 |
| Colorado | 67.6 |
| North Dakota | 67.1 |
| Michigan | 66.9 |
| United States | 66.8 |
| Missouri | 66.8 |
| Connecticut | 66.6 |
| Tennessee | 66.4 |
| Rhode Island | 66.3 |
| Massachusetts | 66.3 |
| Georgia | 66.1 |
| Kansas | 65.7 |
| Wyoming | 65.5 |
| Nebraska | 65.2 |
| California | 65.1 |
| Idaho | 64.9 |
| North Carolina | 64.7 |
| New York | 64.7 |
| Hawaii | 64.3 |
| Texas | 63.9 |
| Alaska | 63.8 |
| Utah | 63.6 |
| South Carolina | 63.4 |
| New Mexico | 62.6 |
| Florida | 62.1 |
| Louisiana | 61.9 |
| Nevada | 61.5 |
| Indiana | 61.0 |
| Alabama | 60.5 |
| South Dakota | 58.5 |
| Oklahoma | 58.3 |
| West Virginia | 56.1 |
| Arkansas | 54.0 |
The 2020 presidential election between Joe Biden and Donald Trump saw the highest voter turnout of the 21st century, despite challenges posed by the pandemic. Nearly 67% of eligible U.S. citizens aged 18 or older cast their ballot, a 5 percentage point increase from the 2016 election.
This was the largest increase in voter participation between two consecutive presidential elections, with 17 million more Americans voting in 2020 compared to 2016.
Notably, a large share of young voters did not show up to the polls in 2016. Just 43.4% of eligible American citizens under 30 voted in 2016, a substantial difference from the 71.4% of over-60s who voted, according to Our World in Data.
How States’ Voter Turnouts Affected the 2020 Election
In 2020, D.C. led the nation with an 84% turnout, while Arkansas had the lowest at 54%. Blue states generally saw higher voter participation than red ones. Fifteen out of the top 20 states by voter turnout were won by Democrats in the 2020 election.
Five states flipped from Republican to Democrat in the 2020 election: Arizona, Georgia, Michigan, Pennsylvania, and Wisconsin. All of these states, except Georgia, were in the top half of states by voter turnout, and Wisconsin and Arizona were in the top 10.
Considering just 44,000 votes in Wisconsin, Arizona, and Georgia separated Biden and Trump from a tie in electoral colleges, it’s safe to say voter turnout in these swing states were crucial to Biden’s 2020 victory.
Learn More on the Voronoi App
To learn more about the numbers behind elections, check out this graphic that shows the total amount raised by Democrats and Republicans in every election since 2000.
The post Mapped: Voter Turnout in the 2020 U.S. Presidential Election by State appeared first on Visual Capitalist.