
Published
44 minutes ago
on
October 27, 2025
| 10 views
-->
By
Julia Wendling
Article & Editing
- Alan Kennedy
- Cody Good
Graphics & Design
- Zack Aboulazm
- Athul Alexander
The following content is sponsored by Global X ETFs
Ranked: P/E Ratios in Emerging vs. Developed Markets
Key Takeaways
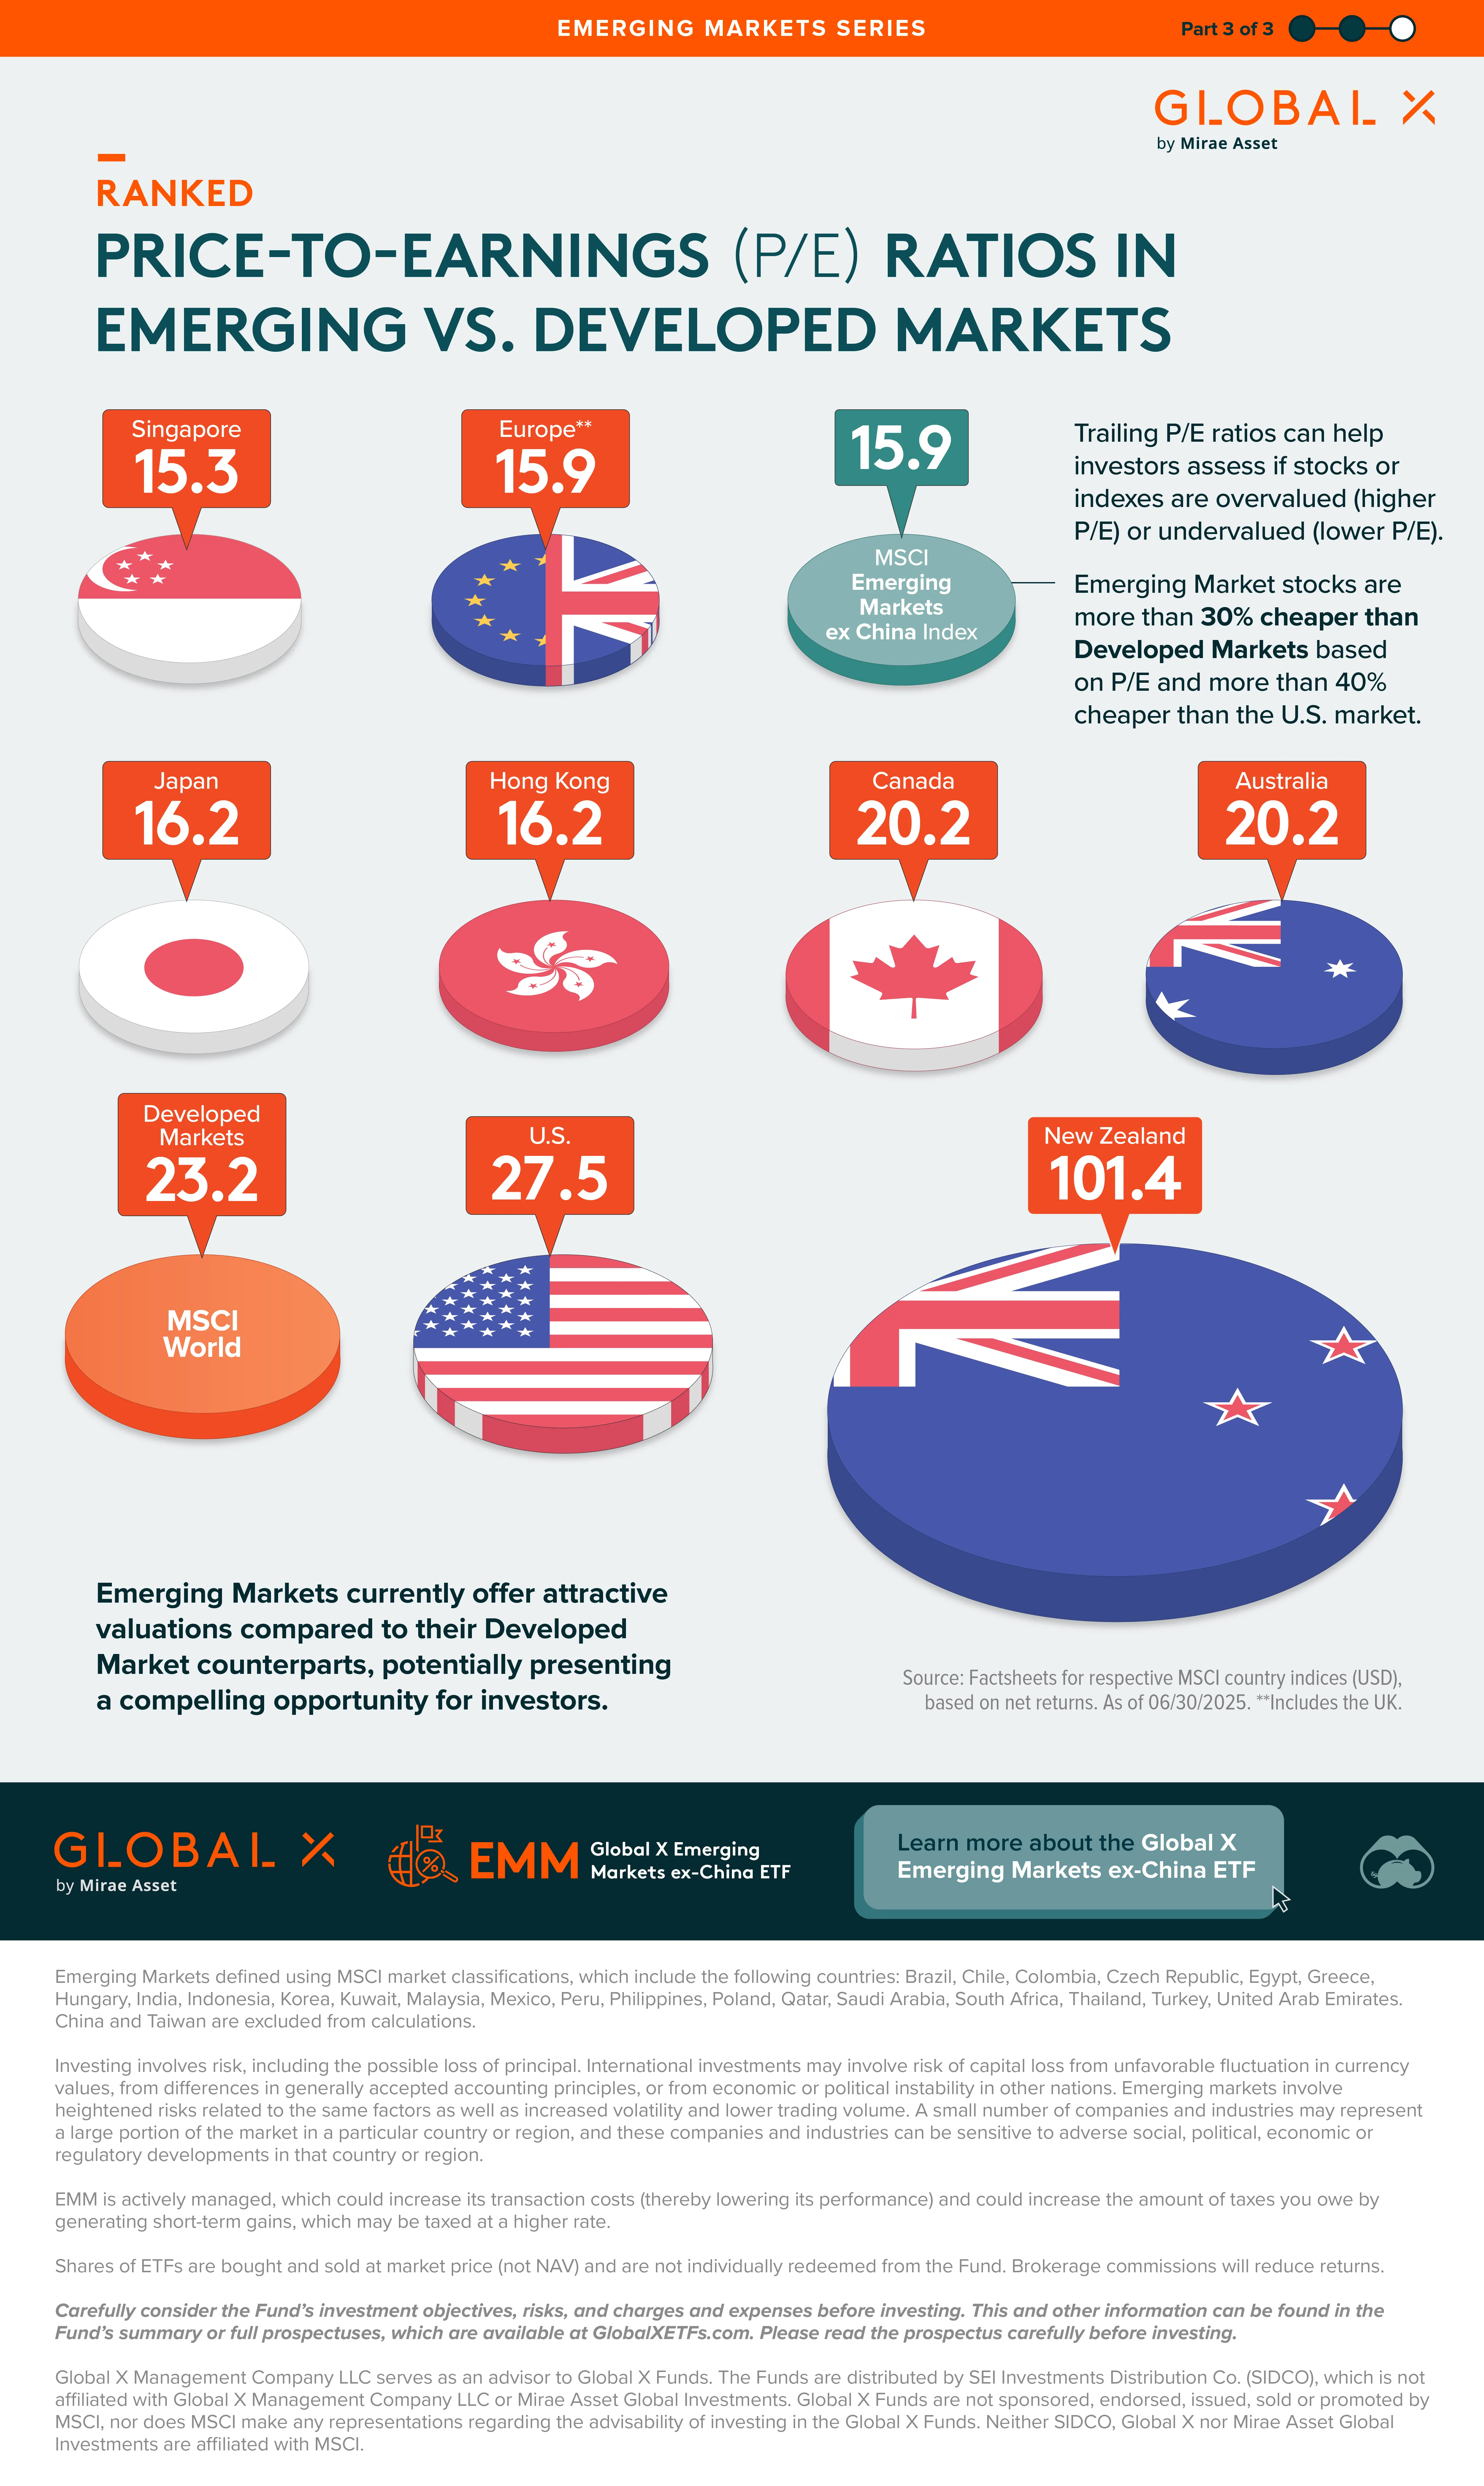
- Emerging market stocks trade at P/E ratios over 30% lower than developed markets, and more than 40% lower than U.S. equities.
- Singaporean stocks have the lowest price-to-earnings (P/E) ratio: 15.3.
- New Zealand stocks have the highest P/E ratio: 101.4
Emerging Markets (EMs) often offer attractive stock valuations, with lower price-to-earning ratios (P/E ratios) that may still deliver strong returns for investors.
In this graphic, the third and final in the EMs Series, Visual Capitalist has partnered with Global X ETFs to explore the P/E ratios of Emerging and Developed Markets.
P/E Ratios
The P/E ratio is among investors’ most common metrics for evaluating investment viability. These ratios compare a company’s current stock price to its earnings per share.
Below is a ranking of 10 markets by their P/E ratio, provided by MSCI:
| Rank | Country/Region | P/E Ratio |
|---|---|---|
| 1 | Singapore | 15.3 |
| 2 | Europe & UK | 15.9 |
| 3 | Emerging Markets ex China | 15.9 |
| 4 | Japan | 16.2 |
| 5 | Hong Kong | 16.2 |
| 6 | Canada | 20.2 |
| 7 | Australia | 20.2 |
| 8 | Developed Markets | 23.2 |
| 9 | U.S. | 27.5 |
| 10 | New Zealand | 101.4 |
Essentially, it shows how much investors will pay for each dollar of a company’s earnings. Investors can also extrapolate this ratio to gain the P/E ratios of all companies in a country.
Undervalued Emerging Markets
Trailing P/E ratios can help investors assess if stocks or indexes are overvalued (higher P/E) or undervalued (lower P/E).
Singapore, for example, has the lowest P/E ratio, 15.3, which means that Singaporean companies are likely undervalued compared to their earnings. New Zealand, on the other hand, has the highest P/E ratio, over three times greater than the U.S. P/E ratio–101.4.*
*as of 06/30/2025
EM (excluding China) stocks are generally undervalued compared to their earnings, with their stock prices being around 30% cheaper than their contemporaries in Developed Markets and 40% cheaper than U.S. stocks.
Unlocking Frontier Opportunities
EMs offer attractive valuations compared to their Developed Market counterparts, potentially presenting a compelling opportunity for investors.
Are you interested in exploring the dynamic Emerging Markets landscape?
The Global X Emerging Markets ex-China ETF (EMM) seeks to invest in companies, excluding those in China, that can achieve or maintain a dominant position within their respective markets.

Learn more about the Global X Emerging Markets ex-China ETF (EMM).
More from Global X ETFs
-
Economy2 hours ago
Charted: Foreign Direct Investment in Emerging Markets
Emerging Markets drew $430B in foreign direct investment in 2022, outpacing global growth. How have these trends evolved over time?
-
Economy4 hours ago
Mapped: Population of Emerging Markets
Emerging Markets are countries transitioning from developing to developed status. How significant are they in terms of global population?
-
Markets1 month ago
Charted: The Rising Share of U.S. Data Center Power Demand
As advanced AI adoption surges, U.S. data center demand is projected to reach nearly 12% of the nation’s power.
-
Markets1 month ago
What’s Driving America’s Growing Electricity Demand?
The U.S. EIA believes that by 2050, U.S. power demand will surge by nearly 50%.
-
Energy2 months ago
Breaking Down America’s $3.7 Trillion Infrastructure Funding Gap
Despite many government efforts to modernize U.S. infrastructure, the funding gap stood at a staggering $3.7 trillion in 2025.
-
Politics4 months ago
Breaking Down the West’s $146 Billion 2024 Defence Technology Investment
Visual Capitalist has partnered with Global X ETFs to break down the $146 billion spent on defence technology by the U.S. and the EU.
-
Politics4 months ago
Mapped: How NATO Defence Spending Has Changed Since the Ukraine-Russia War
Visual Capitalist has partnered with Global X ETFs to explore how NATO defence spending has changed since the start of the Ukrain-Russia war.
-
Politics4 months ago
Visualized: Global Defence Spending in 2024
Visual Capitalist has partnered with Global X ETFs to explore global defence spending and find out which nation spends the most on defence.
-

Economy5 months ago
Breaking Down the 117th Congress’s $1.2T Infrastructure Investment
Graphic showing U.S. infrastructure investment highlighting that investment is primarily going to roads, bridges, and other major projects.
-
Economy5 months ago
Report Card: Grading U.S. Infrastructure
This graphic shows U.S infrastructure grades and highlights the general low grade.
-
Energy10 months ago
Nuclear Energy Supply Forecast by Region
Visual Capitalist and Global X partnered to explore global nuclear energy demand, and how it’s changing, in the coming years.
-
Energy10 months ago
Charted: $300 Billion in Global Nuclear Energy Investment
Visual Capitalist and Global X partnered to explore nuclear energy investment and find out which regions spent the most on nuclear power.
-
Energy10 months ago
Visualized: Nuclear Energy Generation by Region
Visual Capitalist and Global X ETFs explore regional nuclear energy generation and why nuclear energy is critical to the energy transition.
-
Technology12 months ago
Ranked: Which Countries Have the Most Data Centers?
For this graphic, Visual Capitalist partnered with Global X ETFs to rank the nations by the number of data centers they currently operate.
-

Technology12 months ago
Charted: How Much Data is Stored Online?
For this graphic, Visual Capitalist has partnered with Global X ETFs to explore online data generation and show how much data could be generated between 2015…
-
Technology12 months ago
Visualized: The Impact of AI on Revenue
In this graphic, Visual Capitalist has partnered with Global X ETFs to explore the financial impact of AI adoption across various industries.
-

Green2 years ago
Mapped: U.S. Investment in Sustainable Infrastructure (2021-2023)
This graphic shows high levels of investment in U.S. clean infrastructure between 2021 and 2023.
-

Technology2 years ago
Visualized: What is the Artificial Intelligence of Things?
Explore the explosive growth of the Artificial Intelligence of Things (AIoT) industry and its transformative impact across sectors.
-

Technology2 years ago
A Visual Guide to AI Adoption, by Industry
AI adoption impacts many industries, with finance leading. Discover how AI tools optimize operations, mitigate risks, and drive growth.
-

Technology2 years ago
Ranked: Artificial Intelligence Startups, by Country
Find out which countries are winning the race when it comes to the number of AI startups and private investment .
-
Technology3 years ago
On the Road to Electric Vehicles
Electric vehicles are playing a key role in the decarbonization of road transport. But how much further do we need to go to hit net zero?
-
Mining3 years ago
Should You Invest in Disruptive Materials?
Disruptive materials are experiencing a demand supercycle. See how these materials are helping revolutionize next generation technologies.
-
Technology3 years ago
Thematic Investing: 3 Key Trends in Cybersecurity
Cyberattacks are becoming more frequent and sophisticated. Here’s what investors need to know about the future of cybersecurity.
Subscribe
Please enable JavaScript in your browser to complete this form.Join 375,000+ email subscribers: *Sign Up

