![]()
See this visualization first on the Voronoi app.
Use This Visualization
Top and Bottom U.S. Cities by Health Insurance Coverage
This was originally posted on our Voronoi app. Download the app for free on iOS or Android and discover incredible data-driven charts from a variety of trusted sources.
In 2023, 92% or 305 million Americans had health insurance, either for some or all of the year.
Health insurance coverage varies widely across the country, shaped by differences in state policies, economic conditions, and local job markets.
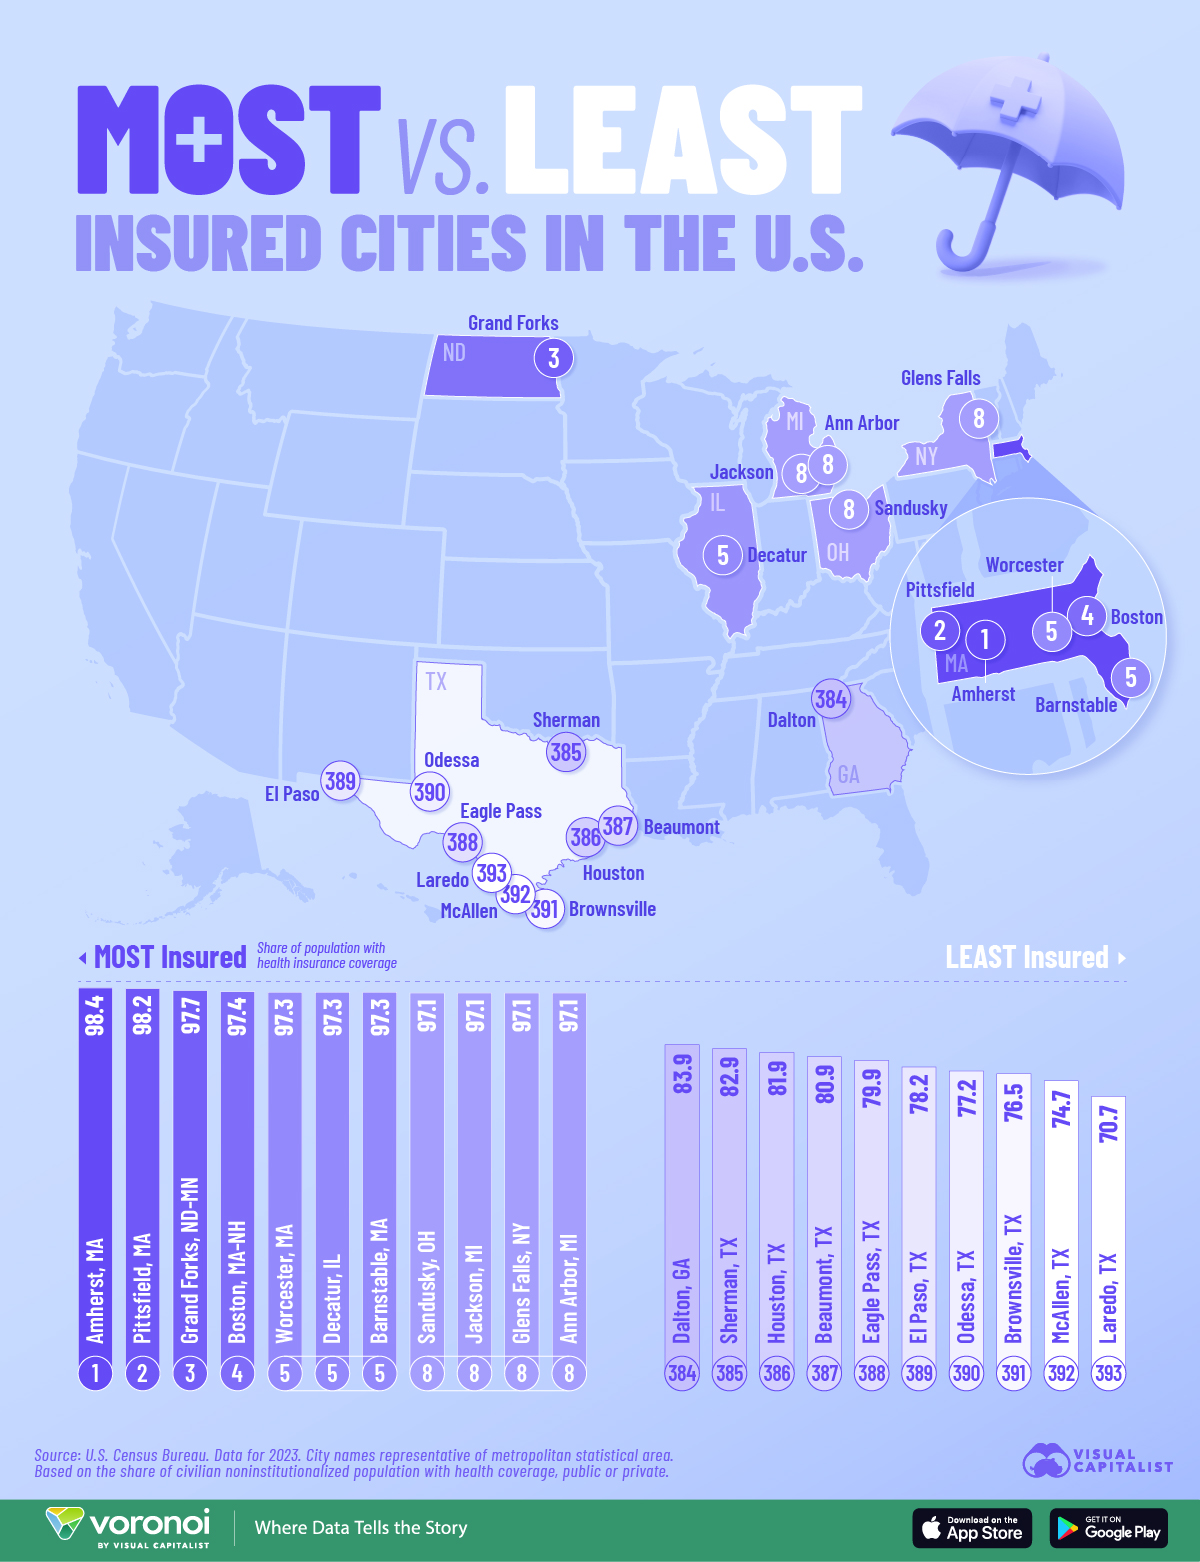
This map shows the top and bottom U.S. metropolitan areas by share of residents with health insurance, based on data from the U.S. Census Bureau.
Data is for 2023 and shows the share of civilian noninstitutionalized population with health coverage, public or private.
Cities With the Highest Rates of Health Insurance Coverage
In this table, we show the top U.S. metro areas by share of residents with health insurance.
| Ranking | Metropolitan area | Share of population with health insurance coverage |
|---|---|---|
| 1 | Amherst Town-Northampton, MA | 98.4 |
| 2 | Pittsfield, MA | 98.2 |
| 3 | Grand Forks, ND-MN | 97.7 |
| 4 | Boston-Cambridge-Newton, MA-NH | 97.4 |
| 5 | Worcester, MA | 97.3 |
| 5 | Decatur, IL | 97.3 |
| 5 | Barnstable Town, MA | 97.3 |
| 8 | Sandusky, OH | 97.1 |
| 8 | Jackson, MI | 97.1 |
| 8 | Glens Falls, NY | 97.1 |
| 8 | Ann Arbor, MI | 97.1 |
Amherst, Massachusetts was the most insured metro area in the U.S. in 2023, with 98.4% of its residents covered under some sort of health insurance.
The cities with the highest rates of health insurance coverage are mostly concentrated in Massachusetts—one of the top states by median income and average hourly wage—and the Midwest.
Massachusetts is also one of the most highly educated states, which has shown to have a correlation with health insurance coverage.
Cities With the Lowest Rates of Health Insurance Coverage
Below we show the bottom U.S. metro areas by share of residents with health insurance.
| Ranking | Metropolitan area | Share of population with health insurance coverage | ||
|---|---|---|---|---|
| 384 | Dalton, GA | 83.9 | ||
| 385 | Sherman-Denison, TX | 82.9 | ||
| 386 | Houston-Pasadena-The Woodlands, TX | 81.9 | ||
| 387 | Beaumont-Port Arthur, TX | 80.8 | ||
| 388 | Eagle Pass, TX | 79.9 | ||
| 389 | El Paso, TX | 78.2 | ||
| 390 | Odessa, TX | 77.2 | ||
| 391 | Brownsville-Harlingen, TX | 76.5 | ||
| 392 | McAllen-Edinburg-Mission, TX | 74.7 | ||
| 393 | Laredo, TX | 70.7 |
Laredo, a border city in Southern Texas was the metro area with the lowest share of residents with health insurance at 70.7%.
Texas dominates the bottom of the ranking, with 7 of the 10 lowest-coverage metro areas. Many border cities including Laredo, McAllen (74.7%), and Brownsville (76.5%) have some of the lowest rates of insured populations.
Texas is one of 10 states that did not expand Medicaid under the Affordable Care Act.
It also has some of the highest health care insurance costs in the country, which contributes to its relatively lower share of insured residents.
Learn More on the Voronoi App ![]()
To learn health care insurance in the U.S., check out this graphic that visualizes life expectancy and health spending per capita across developed nations.