
Published
September 15, 2026 8:42 am
| 395 views
-->
By
Ryan Bellefontaine
Design
- Akhila Ayyalasomayajula
- Athul Alexander
- Abha Patil
The following content is sponsored by Shale Crescent USA
Ranked: U.S. Natural Gas vs. Countries
Key Takeaways
- Shale Crescent USA ranks #1 among U.S. producing regions and #2 when compared to other nations.
- Appalachia (Shale Crescent USA) produces more natural gas than major countries including Iran, China, Canada, and Qatar.
- Abundant natural gas can provide manufacturers with long-term energy and operational advantages.
Natural gas production shapes industrial competitiveness around the world.
Regions with abundant, reliable energy often attract manufacturers, power generators, and other energy-intensive operations seeking long-term cost and competitive advantages.
This graphic, in partnership with Shale Crescent USA, shows how major U.S. natural gas-producing regions compare against entire countries using data from the U.S. Energy Information Administration (EIA) and the Energy Institute.
U.S. Regions Compete on a Global Stage
The United States already leads the world in natural gas production. However, several U.S. producing regions rival major energy-producing nations on their own.
Here is a table that shows natural gas production across leading countries and major U.S. producing regions.
| Rank | Country/Region | Natural Gas Production in 2025 (Bcf/d) |
|---|---|---|
| 1 | Russia | 59.0 |
| 2 | Shale Crescent USA | 36.7 |
| 3 | Permian | 27.6 |
| 4 | Iran | 25.6 |
| 5 | China | 25.6 |
| 6 | Rest of Lower 48 States | 25.5 |
| 7 | Canada | 20.0 |
| 8 | Qatar | 17.8 |
| 9 | Haynesville | 15.0 |
| 10 | Australia | 14.4 |
| 11 | Saudi Arabia | 12.9 |
| 12 | Norway | 11.7 |
| 13 | Algeria | 9.5 |
| 14 | Malaysia | 7.8 |
| 15 | Eagle Ford | 7.4 |
| 16 | Turkmenistan | 7.0 |
| 17 | Indonesia | 6.9 |
| 18 | United Arab Emirates | 5.7 |
| 19 | Nigeria | 4.9 |
| 20 | Oman | 4.4 |
| 21 | Argentina | 4.4 |
| 22 | Egypt | 3.9 |
| 23 | Uzbekistan | 3.9 |
| 24 | Kazakhstan | 3.7 |
| 25 | Azerbaijan | 3.7 |
| 26 | Mexico | 3.4 |
| 27 | Bakken | 3.3 |
| 28 | India | 3.0 |
| 29 | Venezuela | 3.0 |
| 30 | United Kingdom | 2.9 |
| 31 | Thailand | 2.8 |
| 32 | Brazil | 2.6 |
| 33 | Israel | 2.5 |
| 34 | Pakistan | 2.4 |
| 35 | Trinidad and Tobago | 2.3 |
Russia leads all countries outside the U.S., producing 59.0 Bcf/d in 2025. However, with 36.6 Bcf/d, the U.S. region of Appalachia (Shale Crescent USA) substantially leads the runner-up nation of Iran.
Appalachia also leads major natural gas-producing countries such as China, Canada, and Qatar.
Why the Shale Crescent Stands Out
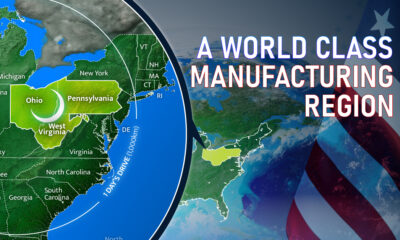
Shale Crescent USA encompasses Ohio, West Virginia, and Pennsylvania, an area that is geographically half the size of Texas and has become one of the world’s most important natural gas-producing hubs.
Its scale creates advantages beyond energy production. Businesses located near abundant natural gas can benefit from reliable supply, reduced transportation costs, and access to a critical industrial feedstock.
The data demonstrates that Shale Crescent USA is not simply a leading U.S. region—it is a globally significant energy producer.
Consequently, manufacturers evaluating new locations may find the region’s combination of scale, reliability, security, and resource availability particularly compelling for their long-term goals.

Build Where Energy is Secure
Related Topics: #natural gas #Gas #Russia #usa #iran #ohio #West Virginia #Pennsylvania
You may also like
-

Energy6 days ago
The World’s Natural Gas Prices Over Time (2006–2026)
Compare natural gas prices across U.S., European, and Asian benchmarks and explore the Shale Crescent’s industrial cost advantage.
-

Energy2 months ago
Mapped: Where is U.S. Natural Gas Produced?
U.S. regional natural gas production in 2026 shows Appalachia leading the nation, reinforcing the Shale Crescent’s industrial edge.
-
Energy12 months ago
The Future of U.S. Natural Gas Production, by Region
EIA projections show the East—powered by the Shale Crescent—leading U.S. natural gas through 2050. Here’s how this shift can translate into a lasting manufacturing cost advantage.
-
Energy1 year ago
Ranked: The Lowest Cost Energy Sources
Shale Crescent USA’s natural gas ranks as the lowest cost energy on a $/BOE basis—outpacing NYMEX, coal, oil, and imported LNG—and offers a manufacturing edge.
-
Energy1 year ago
Who is Growing? U.S. Natural Gas Leaders
Which U.S. regions lead natural gas production growth? See why the Shale Crescent is now fueling millions more homes and factories.
-
Energy1 year ago
Visualized: Where is the Most Natural Gas Production?
See how natural gas production stacks up globally and why the Shale Crescent ranks third—a strategic edge for U.S. manufacturing.
-
Energy1 year ago
Shale Crescent USA: A World-Class Manufacturing Region
Shale Crescent USA brings energy, customers, and infrastructure together in one region, helping manufacturers reduce costs as reshoring accelerates.
Subscribe
Please enable JavaScript in your browser to complete this form.Join 375,000+ email subscribers: *Sign Up