
Published
21 hours ago
on
September 9, 2025
| 21 views
-->
By
Julia Wendling
Graphics & Design
- Zack Aboulazm
The following content is sponsored by Global X


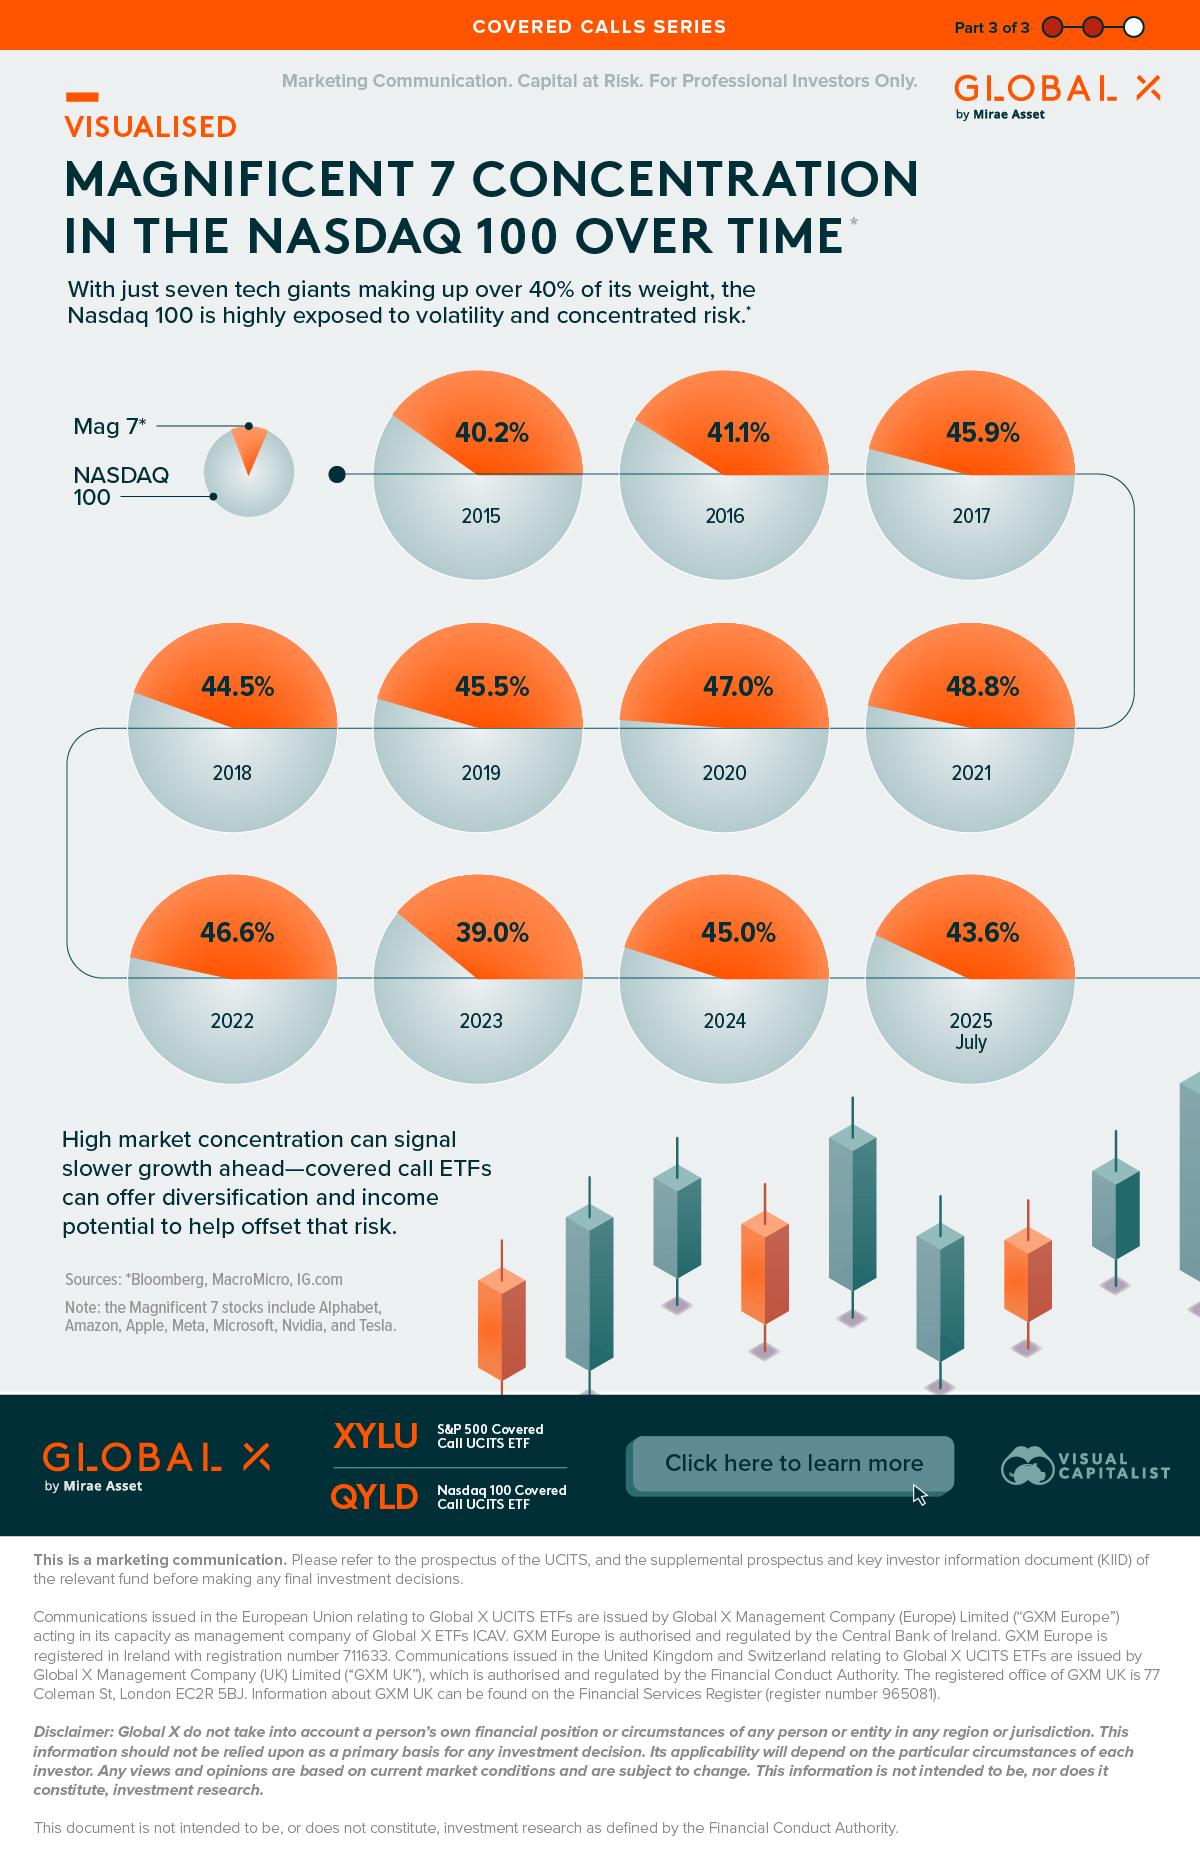
Magnificent 7 Concentration in the Nasdaq 100 Over Time
The Nasdaq 100, a key benchmark for U.S. technology companies, is remarkably concentrated. Just seven stocks make up nearly 40% of the entire index.
This visualisation—created in partnership with Global X and using data from Bloomberg—highlights the extent of this market capitalization concentration. This offers a clear look at how a handful of companies dominate the index.
What Is the Nasdaq 100?
The Nasdaq 100 is one of the most widely followed equity indices in the world. It tracks the performance of the 100 largest non-financial companies listed on the Nasdaq Stock Exchange. While it is best known for its heavy weighting in technology firms, the index also includes some leaders in other sectors.
Unlike the broader Nasdaq Composite, the Nasdaq 100 focuses exclusively on the largest and most influential companies. Because of this, it has become a key benchmark for investors looking to gain exposure to high-growth, large-cap businesses.
What Is Concentration Risk?
The Nasdaq 100’s heavy tilt toward a handful of mega-cap tech stocks creates concentration risk. This means the index’s performance relies too heavily on just a few companies.
These seven giants—Alphabet, Amazon, Apple, Meta, Microsoft, Nvidia, and Tesla, often called the “Magnificent 7”—have dominated the index for years. Their combined weight has hovered around 40% over the past decade, reaching 43.6% as of July.
| Year | Mag 7 Market Concentration in Nasdaq 100 (%) |
|---|---|
| 2015 | 40.2 |
| 2016 | 41.1 |
| 2017 | 45.9 |
| 2018 | 44.5 |
| 2019 | 45.5 |
| 2020 | 47.0 |
| 2021 | 48.8 |
| 2022 | 46.6 |
| 2023 | 39.0 |
| 2024 | 45.0 |
| July 2025 | 43.6 |
Such concentration can also weigh on long-term growth. When market gains are driven by only a few players, it limits broader participation. This makes future returns less sustainable and more uncertain.
Covered Call Options
A Nasdaq 100 covered call ETF offers investors a way to stay exposed to the index while softening the impact of concentration risk. By writing call options on the underlying holdings, these funds generate additional income that can help offset potential losses if a few dominant stocks experience volatility.
![]()
Learn more about the Global X Nasdaq 100 Covered Call UCITS ETF (QYLD) and the Global X S&P 500 Covered Call UCITS ETF (XYLU).
More from Global X
-

Markets21 hours ago
Charted: A Slow-Growth Era for the S&P 500?
The S&P 500 surged in 2023 and 2024, and is on track for nearly 10% gains in 2025—but how long can the rally last?
-

Markets21 hours ago
3 Things to Know About Covered Call Options
Covered call option ETFs offer investors a unique way to generate income—but what exactly are they, and when do they tend to perform best?
-
Economy2 months ago
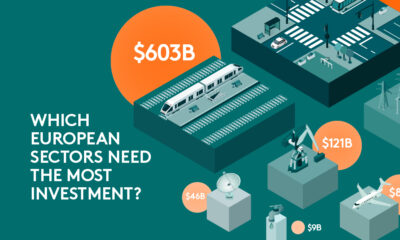
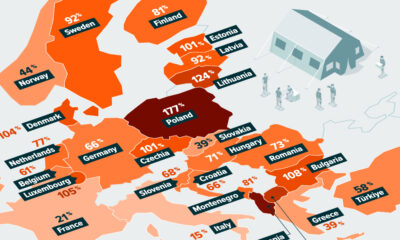
Ranked: Which European Sectors Need the Most Investment?
European infrastructure is under pressure—but not all sectors are being hit equally. Which ones need the most investment in coming years?
-
Economy2 months ago
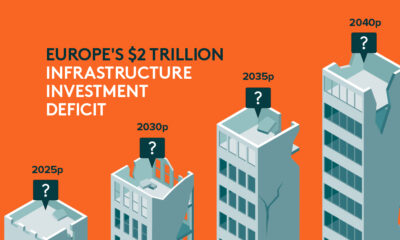
Charted: Europe’s $2 Trillion Infrastructure Investment Deficit
This graphic, created in partnership with Global X, offers visual context to Europe’s widening infrastructure investment gap, using data from Infrastructure Outlook.
-

Economy2 months ago
Breaking Down the €286 EU Billion Infrastructure Spend
This visualization, created in partnership with Global X, offers a clear look at where RRF grants and loans are being directed in the EU, based on…
-
Politics2 months ago
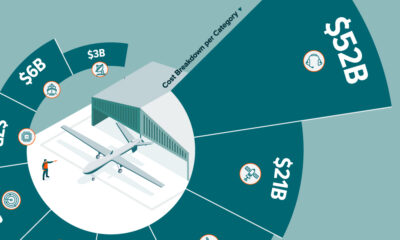
Breaking Down the West’s $146 Billion 2024 Defence Technology Investment
Visual Capitalist has partnered with Global X ETFs to break down the $146 billion spent on defence technology by the U.S. and the EU.
-
Politics2 months ago
Mapped: How NATO Defence Spending Has Changed Since the Ukraine-Russia War
Visual Capitalist has partnered with Global X ETFs to explore how NATO defence spending has changed since the start of the Ukrain-Russia war.
-
Politics2 months ago
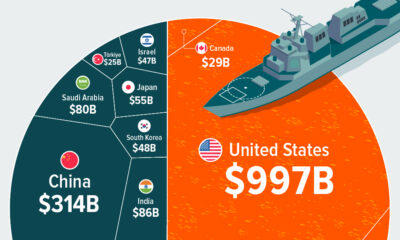
Visualized: Global Defence Spending in 2024
Visual Capitalist has partnered with Global X ETFs to explore global defence spending and find out which nation spends the most on defence.
-
Economy3 months ago
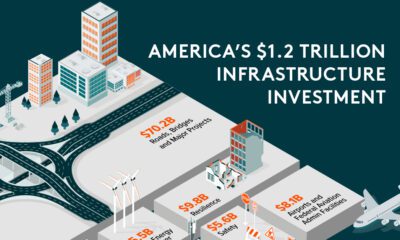
Breaking Down the 117th Congress’s $1.2T Infrastructure Investment
Graphic showing U.S. infrastructure investment highlighting that investment is primarily going to roads, bridges, and other major projects.
-
Economy3 months ago
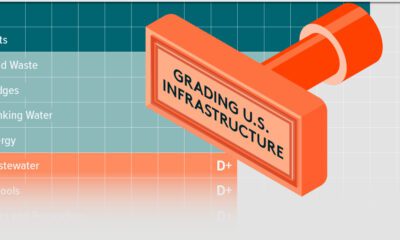
Report Card: Grading U.S. Infrastructure
This graphic shows U.S infrastructure grades and highlights the general low grade.
-
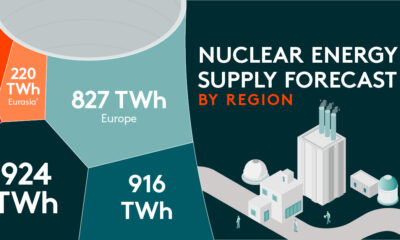
Energy8 months ago
Nuclear Energy Supply Forecast by Region
Visual Capitalist and Global X partnered to explore global nuclear energy demand, and how it’s changing, in the coming years.
-
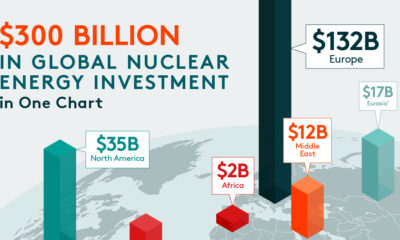
Energy8 months ago
Charted: $300 Billion in Global Nuclear Energy Investment
Visual Capitalist and Global X partnered to explore nuclear energy investment and find out which regions spent the most on nuclear power.
-
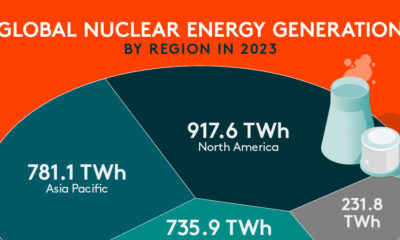
Energy8 months ago
Visualized: Nuclear Energy Generation by Region
Visual Capitalist and Global X ETFs explore regional nuclear energy generation and why nuclear energy is critical to the energy transition.
-
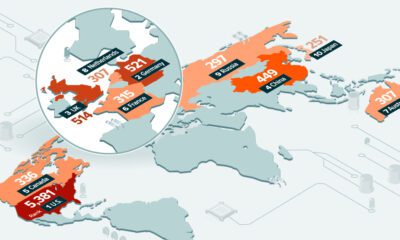
Technology10 months ago
Ranked: Which Countries Have the Most Data Centers?
For this graphic, Visual Capitalist partnered with Global X ETFs to rank the nations by the number of data centers they currently operate.
-

Technology10 months ago
Charted: How Much Data is Stored Online?
For this graphic, Visual Capitalist has partnered with Global X ETFs to explore online data generation and show how much data could be generated between 2015…
-
Technology10 months ago
Visualized: The Impact of AI on Revenue
In this graphic, Visual Capitalist has partnered with Global X ETFs to explore the financial impact of AI adoption across various industries.
-
Green2 years ago
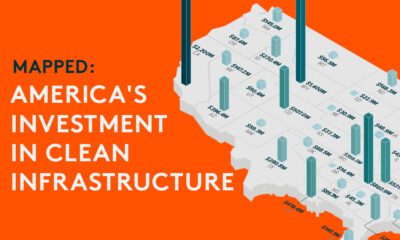
Mapped: U.S. Investment in Sustainable Infrastructure (2021-2023)
This graphic shows high levels of investment in U.S. clean infrastructure between 2021 and 2023.
-

Technology2 years ago
Visualized: What is the Artificial Intelligence of Things?
Explore the explosive growth of the Artificial Intelligence of Things (AIoT) industry and its transformative impact across sectors.
-

Technology2 years ago
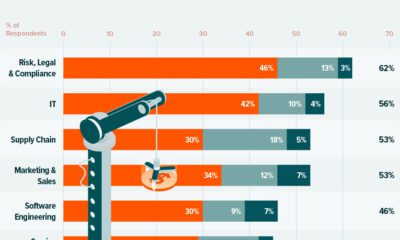
A Visual Guide to AI Adoption, by Industry
AI adoption impacts many industries, with finance leading. Discover how AI tools optimize operations, mitigate risks, and drive growth.
-
Technology2 years ago
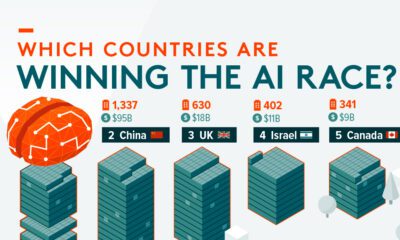
Ranked: Artificial Intelligence Startups, by Country
Find out which countries are winning the race when it comes to the number of AI startups and private investment .
-
Technology3 years ago
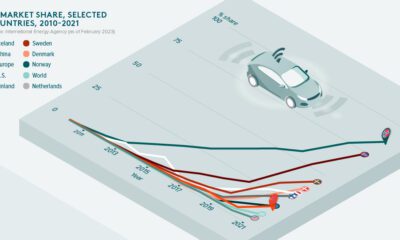
On the Road to Electric Vehicles
Electric vehicles are playing a key role in the decarbonization of road transport. But how much further do we need to go to hit net zero?
-
Mining3 years ago
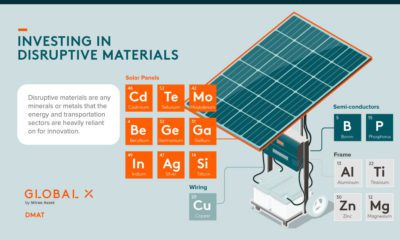
Should You Invest in Disruptive Materials?
Disruptive materials are experiencing a demand supercycle. See how these materials are helping revolutionize next generation technologies.
-
Technology3 years ago
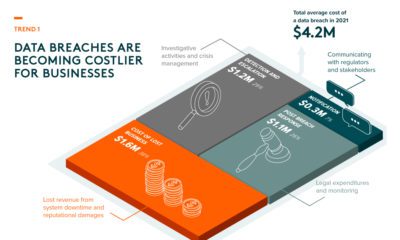
Thematic Investing: 3 Key Trends in Cybersecurity
Cyberattacks are becoming more frequent and sophisticated. Here’s what investors need to know about the future of cybersecurity.
Subscribe
Please enable JavaScript in your browser to complete this form.Join the 375,000+ subscribers who receive our daily email *Sign Up