Visualized: Countries by Container Volume Per Capita
Global trade is a key driver of economic growth in today’s modern economy, but which countries punch above their weight?
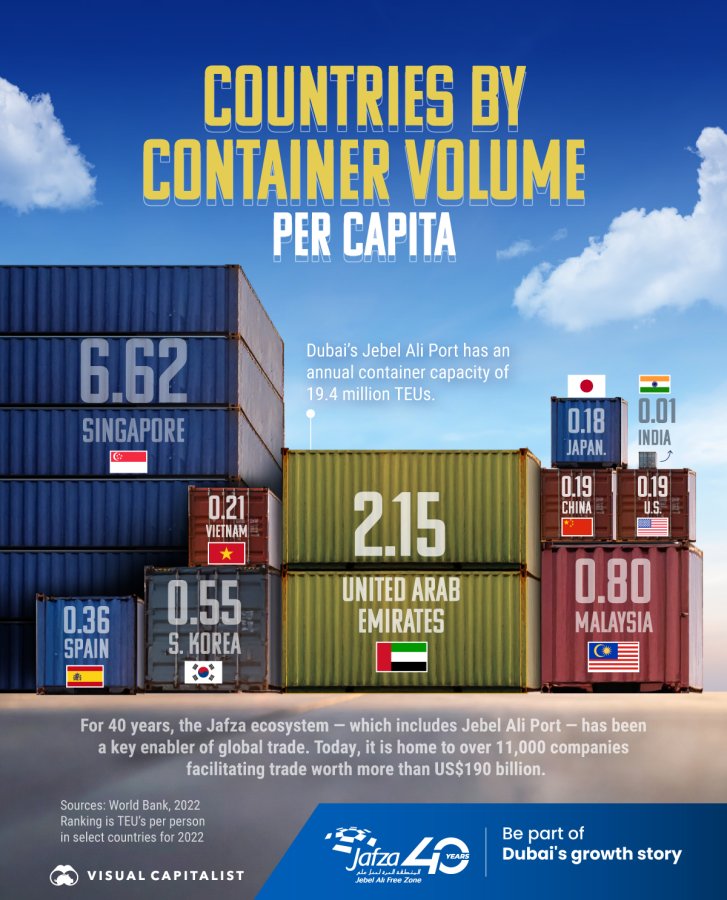
This graphic, created in partnership with DP World, compares select countries on container volume per capita using data from the World Bank’s container traffic (in TEUs) and World Bank populations for 2022.
UAE vs. Singapore
Here is a table that shows the 2022 container volume per capita by country, derived from national TEUs divided by population.
| Country | Container Volume (TEUs, 2022) | Population (2022) | Container Volume Per Capita |
|---|---|---|---|
| Singapore | 37,289,600 | 5,637,000 | 6.62 |
| UAE | 20,300,000 | 9,441,000 | 2.15 |
| Malaysia | 27,293,935 | 33,938,000 | 0.80 |
| South Korea | 28,502,044 | 51,628,000 | 0.55 |
| Spain | 17,161,676 | 47,615,000 | 0.36 |
| Vietnam | 20,518,926 | 98,187,000 | 0.21 |
| China | 268,990,000 | 1,417,173,000 | 0.19 |
| United States | 62,214,119 | 333,288,000 | 0.19 |
| Japan | 22,515,870 | 125,125,000 | 0.18 |
| India | 19,717,168 | 1,417,173,000 | 0.01 |
Singapore tops the ranking thanks to its outsized transshipment role across Southeast Asia. Meanwhile, the UAE places second, supported by Dubai’s Jebel Ali Port and the wider Jafza free zone.
Despite the U.S. and China having the largest container volumes of any countries, the UAE accomplishes 10 times more when adjusting for population.
Moreover, Jebel Ali’s installed capacity reaches 19.4 million TEUs, enabling deep-water, big-ship calls. In turn, the broader Jafza ecosystem has enabled trade for 40 years and today hosts 11,000+ companies, facilitating US$190B+ in commerce.
Why Trade Per Capita Matters
Per-capita trade normalizes scale and highlights logistics ecosystems that serve regions far beyond domestic demand.
We calculate container volume per capita by dividing total 2022 TEUs by each country’s 2022 population. Because TEUs measure capacity, results reflect throughput rather than cargo value.
Where TEU figures cover all national ports, the metric shows how infrastructure scales beyond domestic needs, as a result, transshipment and re-export hubs often rank higher than much larger economies.
For greater context, see how the UAE stacks up on merchandise exports per capita specifically.