![]()
See this visualization first on the Voronoi app.
Use This Visualization
Visualized: How Kids Spend Their Screen Time
This was originally posted on our Voronoi app. Download the app for free on iOS or Android and discover incredible data-driven charts from a variety of trusted sources.
Key Takeaways
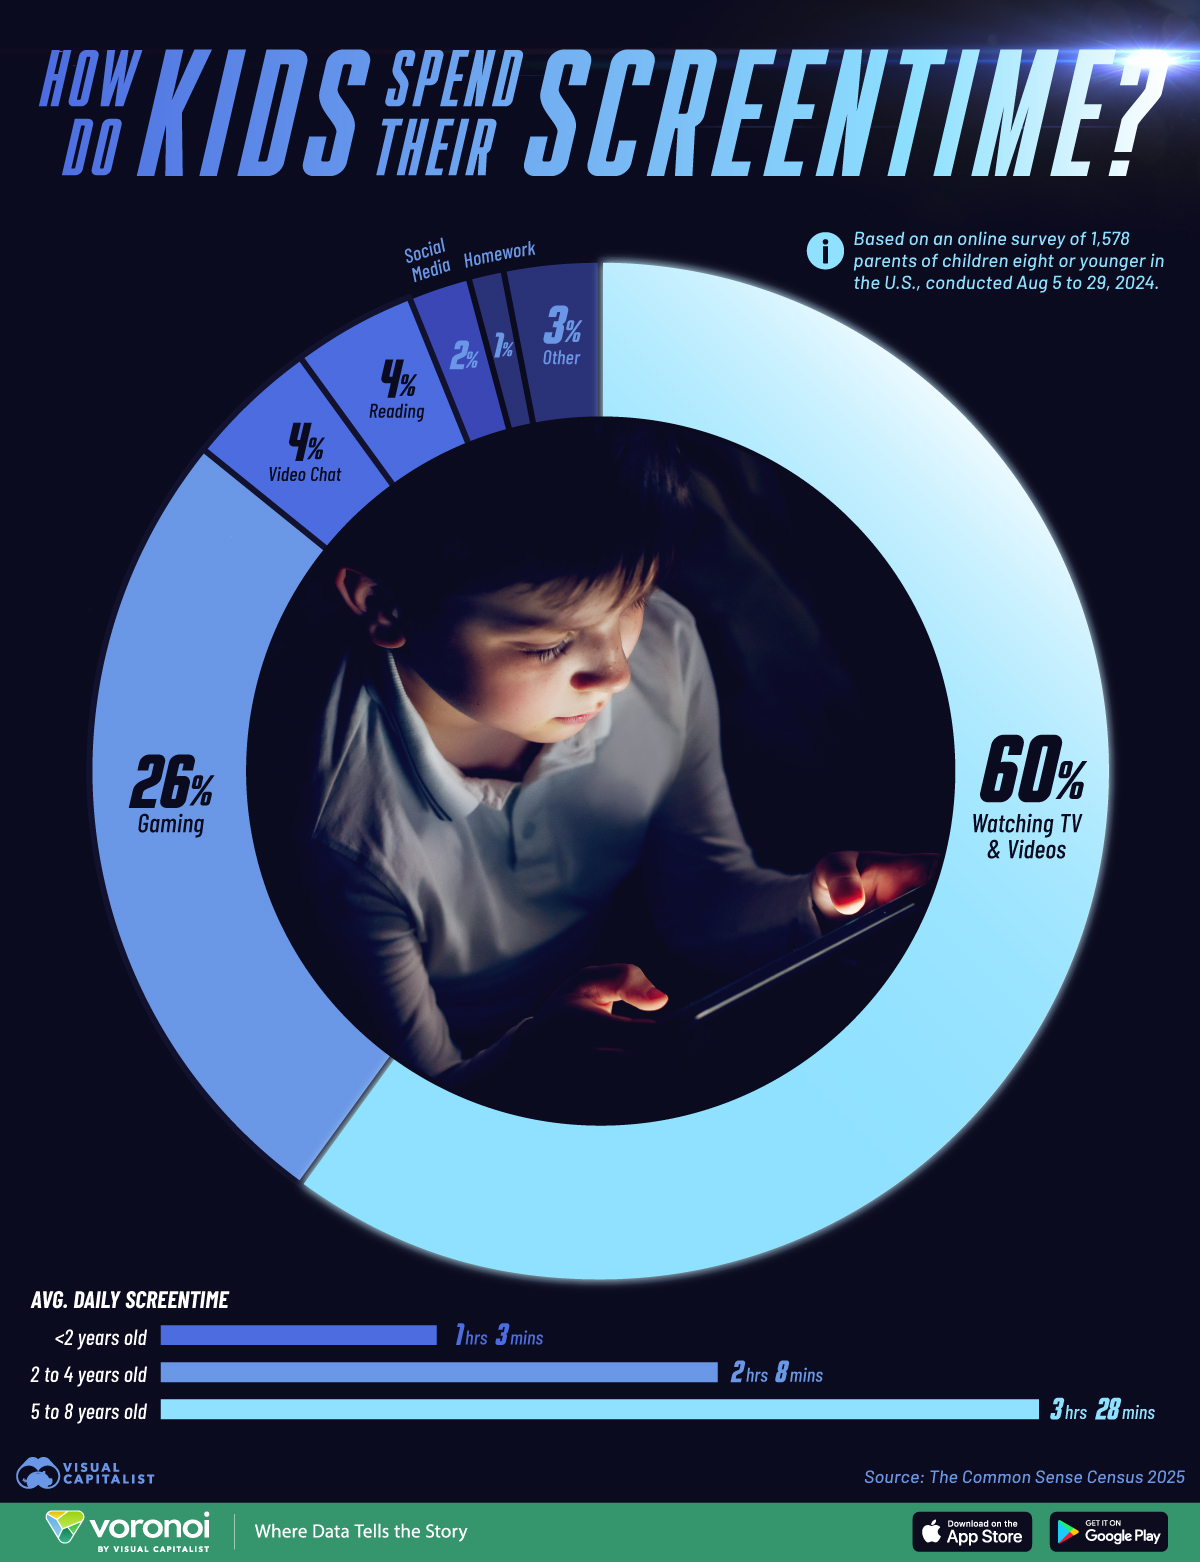
- Watching TV and videos dominates kids’ screen habits, accounting for 60% of all screen time.
- Screen time increases significantly with age, with five- to eight-year-olds reaching an average of three hours and 28 minutes daily.
Children today are surrounded by screens at younger ages than ever before. From television and tablets to gaming and social apps, digital media is a daily part of kids’ lives.
But how much time do they actually spend in front of screens, and what are they doing with that time? This graphic shows the share of screen time kids spend on different activities along with the average daily screen time by age group.
The data is from a survey by The Common Sense Census 2025 of 1,578 parents of children eight or younger in the United States, conducted from August 5 to 29, 2024.
Kids’ Screen Time Habits Are Dominated by Videos
The survey data shows two important patterns: kids spend the majority of their screen time watching videos, and screen exposure grows sharply with age.
The share of screen time spent by activity is shown in the table below:
| Screen time activity | Share of screen time spent (0 to 8 year olds) |
|---|---|
| TV/video viewing | 60% |
| Gaming | 26% |
| Video-chatting | 4% |
| Reading (electronic) | 4% |
| Social networking | 2% |
| Homework | 1% |
| Other | 3% |
TV and video viewing account for 60% of kids’ total screen time, making passive watching the default mode for most children.
Gaming is second at 26%, pushing the combined “watch + play” share to 86% of the day on screens.
Reading on screens (4%), video-chatting (4%), social networking (2%), homework (1%), and other activities (3%) together make up the remaining 14%.
In short: entertainment activities crowd out everything else.
Kids’ Screen Time Rises Sharply With Age
Daily usage climbs quickly as children get older: from an average of just over 1 hour for children under age 2 to over 2 hours at ages 2–4.
As the table below shows, the increase for ages 5–8 is even more significant at 3 hours 28 minutes.
| Age | Average daily screentime (hours:minutes) |
|---|---|
| Under 2 years old | 1:03 |
| 2 to 4 years old | 2:08 |
| 5 to 8 years old | 3:28 |
That’s roughly double between under-2s and ages 2–4 (103% increase), and another big jump of 1 hour 20 minutes into the early school years (63% increase).
From the youngest babies to ages 5–8, total screen time rises by 145 minutes per day—about a 230% increase.
This pattern reflects greater access to devices, longer attention spans, and more autonomy as kids age.
Learn More on the Voronoi App ![]()
To learn about kids and their relationship with technology, check out this graphic that charts out tablet and cell phone ownership among children aged two to eight on Voronoi, the new app from Visual Capitalist.