
Published
57 minutes ago
on
January 22, 2026
| 2,115 views
-->
By
Ryan Bellefontaine
Graphics & Design
- Athul Alexander
The following content is sponsored by BHP
Visualized: U.S. Data Center Investment (2014–2025)
Data centers have quietly become some of the most important infrastructure in the U.S. economy. As artificial intelligence (AI) workloads explode and cloud services proliferate, builders are racing to add capacity at record speed.
This graphic, in partnership with BHP, shows U.S. data center construction spending from 2014 to 2025 using data from the U.S. Census Bureau.
AI-Era Data Center Construction Boom
Here is a table showing monthly U.S. data center construction since 2014, seasonally adjusted at an annual rate.
| Month | Billions of Current U.S. Dollars (Seasonally Adjusted Annual Rate) |
|---|---|
| Jul-25 | 41.19 |
| Jun-25 | 41.10 |
| May-25 | 40.07 |
| Apr-25 | 39.60 |
| Mar-25 | 36.88 |
| Feb-25 | 37.13 |
| Jan-25 | 35.77 |
| Dec-24 | 34.98 |
| Nov-24 | 35.62 |
| Oct-24 | 35.86 |
| Sep-24 | 32.96 |
| Aug-24 | 32.94 |
| Jul-24 | 31.74 |
| Jun-24 | 31.24 |
| May-24 | 29.98 |
| Apr-24 | 28.34 |
| Mar-24 | 27.78 |
| Feb-24 | 26.29 |
| Jan-24 | 24.93 |
| Dec-23 | 24.45 |
| Nov-23 | 23.72 |
| Oct-23 | 23.84 |
| Sep-23 | 21.13 |
| Aug-23 | 20.25 |
| Jul-23 | 19.55 |
| Jun-23 | 18.62 |
| May-23 | 18.11 |
| Apr-23 | 18.16 |
| Mar-23 | 18.10 |
| Feb-23 | 17.87 |
| Jan-23 | 15.85 |
| Dec-22 | 14.35 |
| Nov-22 | 13.77 |
| Oct-22 | 12.88 |
| Sep-22 | 14.47 |
| Aug-22 | 13.02 |
| Jul-22 | 12.71 |
| Jun-22 | 12.15 |
| May-22 | 12.08 |
| Apr-22 | 12.26 |
| Mar-22 | 11.36 |
| Feb-22 | 10.53 |
| Jan-22 | 11.08 |
| Dec-21 | 11.39 |
| Nov-21 | 10.51 |
| Oct-21 | 9.74 |
| Sep-21 | 10.77 |
| Aug-21 | 10.43 |
| Jul-21 | 9.73 |
| Jun-21 | 9.30 |
| May-21 | 9.31 |
| Apr-21 | 9.44 |
| Mar-21 | 10.32 |
| Feb-21 | 9.04 |
| Jan-21 | 9.31 |
| Dec-20 | 9.23 |
| Nov-20 | 9.18 |
| Oct-20 | 9.34 |
| Sep-20 | 10.05 |
| Aug-20 | 9.07 |
| Jul-20 | 8.73 |
| Jun-20 | 8.97 |
| May-20 | 8.70 |
| Apr-20 | 8.95 |
| Mar-20 | 9.49 |
| Feb-20 | 9.68 |
| Jan-20 | 9.46 |
| Dec-19 | 7.94 |
| Nov-19 | 9.57 |
| Oct-19 | 9.16 |
| Sep-19 | 8.08 |
| Aug-19 | 8.82 |
| Jul-19 | 8.82 |
| Jun-19 | 8.88 |
| May-19 | 8.74 |
| Apr-19 | 7.86 |
| Mar-19 | 7.67 |
| Feb-19 | 8.03 |
| Jan-19 | 8.12 |
| Dec-18 | 8.05 |
| Nov-18 | 7.10 |
| Oct-18 | 7.86 |
| Sep-18 | 6.29 |
| Aug-18 | 7.00 |
| Jul-18 | 7.45 |
| Jun-18 | 7.06 |
| May-18 | 6.99 |
| Apr-18 | 6.56 |
| Mar-18 | 6.47 |
| Feb-18 | 6.24 |
| Jan-18 | 6.08 |
| Dec-17 | 5.74 |
| Nov-17 | 5.46 |
| Oct-17 | 4.96 |
| Sep-17 | 4.69 |
| Aug-17 | 4.39 |
| Jul-17 | 4.67 |
| Jun-17 | 4.58 |
| May-17 | 5.03 |
| Apr-17 | 4.23 |
| Mar-17 | 3.99 |
| Feb-17 | 4.22 |
| Jan-17 | 3.99 |
| Dec-16 | 4.46 |
| Nov-16 | 3.96 |
| Oct-16 | 3.70 |
| Sep-16 | 4.22 |
| Aug-16 | 4.58 |
| Jul-16 | 4.25 |
| Jun-16 | 4.56 |
| May-16 | 4.15 |
| Apr-16 | 4.42 |
| Mar-16 | 4.12 |
| Feb-16 | 3.80 |
| Jan-16 | 3.16 |
| Dec-15 | 3.09 |
| Nov-15 | 2.98 |
| Oct-15 | 2.75 |
| Sep-15 | 2.80 |
| Aug-15 | 2.84 |
| Jul-15 | 2.68 |
| Jun-15 | 3.93 |
| May-15 | 3.34 |
| Apr-15 | 2.31 |
| Mar-15 | 2.14 |
| Feb-15 | 1.93 |
| Jan-15 | 1.92 |
| Dec-14 | 1.66 |
| Nov-14 | 1.95 |
| Oct-14 | 1.83 |
| Sep-14 | 1.92 |
| Aug-14 | 1.96 |
| Jul-14 | 1.79 |
| Jun-14 | 1.75 |
| May-14 | 1.81 |
| Apr-14 | 1.80 |
| Mar-14 | 1.68 |
| Feb-14 | 1.74 |
| Jan-14 | 1.64 |
In early 2014, U.S. data center construction ran at an annualized rate of roughly $1.6 billion. By July 2025, that number reached about $41.0 billion, more than 25 times the 2014 level.
Consequently, data centers now compete directly with offices, warehouses, and industrial facilities for land, power, and transmission capacity.
Why the Data Center Boom Matters for Copper
A typical data center uses roughly 27 metric tons of copper per megawatt of capacity for power, cabling, and cooling. Because each new megawatt adds more copper-intensive equipment, incremental AI capacity has a disproportionate impact on metal demand.As operators add AI servers and dense racks, each data center concentrates more copper in cables, transformers, and cooling infrastructure.
BHP projects that the amount of copper used in data centers globally will increase by around 6x from 2025 to 2050, rising from about 0.5 million tonnes a year to around 3 million tonnes.
That uplift is roughly equivalent to the combined annual output of the world’s four largest copper mines today. As this layer of “digital” demand stacks on top of the broader energy transition, data centers could become one of the fastest-growing sources of structural copper demand.
What Comes Next for Infrastructure and Power
Looking ahead, the U.S. grid will neeed to keep pace with this construction surge as data centers use more electricity.
Data centers’ share of global electricity demand could rise from about 2% today to roughly 9% by 2050, with some markets already seeing data centers account for around one-fifth of national power use.
Overall, surging U.S. data center investment signals rapid AI infrastructure growth. It also demonstrates the central roles of copper and electricity in enabling the next era of digital services.
![]()
Read more insights from a World-Leading Copper Producer
Related Topics: #bhp #data centers #ai #commodities #investment #copper
Click for Comments
var disqus_shortname = "visualcapitalist.disqus.com";
var disqus_title = "Visualized: U.S. Data Center Investment (2014–2025)";
var disqus_url = "https://www.visualcapitalist.com/sp/bhp01-visualized-u-s-data-center-investment-2014-2025/";
var disqus_identifier = "visualcapitalist.disqus.com-185026";
More from BHP
-

Commodities2 months ago
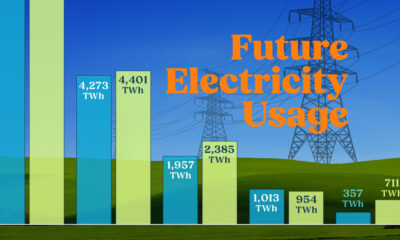
Visualized: Future Electricity Usage by Country (2024–2035)
Projected electricity usage growth and economic development are driving global copper demand—see how energy use is rising from 2024 to 2035.
-
Commodities7 months ago
Charted: Future Electricity Usage by Country
Projected electricity usage growth in major economies is driving global copper demand—see how energy use is rising from 2023 to 2035.
-

Agriculture7 months ago
Visualized: The Surge in Global Potash Demand
Global potash demand is projected to rise 65% by 2050. See what’s driving the surge and why potash is key to global food security.
-
Agriculture11 months ago
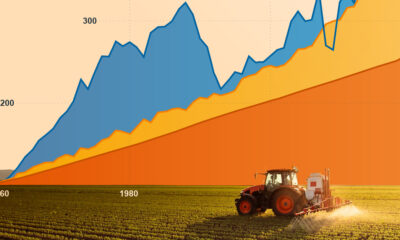
Population Growth, Crop Production, and Fertilizer Use Since 1960
Since 1960, potash demand has outpaced both population growth and crop production.
-
Mining1 year ago
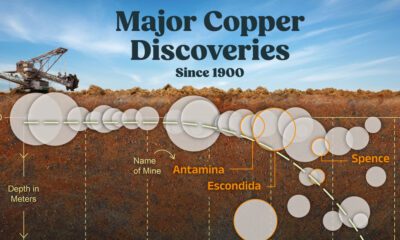
Charted: Major Copper Discoveries Since 1900
Copper discoveries are becoming increasingly rare and often found deeper underground.
-

Mining1 year ago
Chart: Global Copper Demand (2021-2050P)
Copper demand globally is estimated to rise by 70% from 2021 to 2050. What are the main sources of this increase in demand?
-

Mining2 years ago
China’s Steel Demand Through Time
China’s steel demand remains robust, but the breakdown on a sectoral level has shifted since 2010. Which sectors are driving steel consumption?
Subscribe
Please enable JavaScript in your browser to complete this form.Join 375,000+ email subscribers: *Sign Up