Visualizing U.S. EV Sales in H1 2023
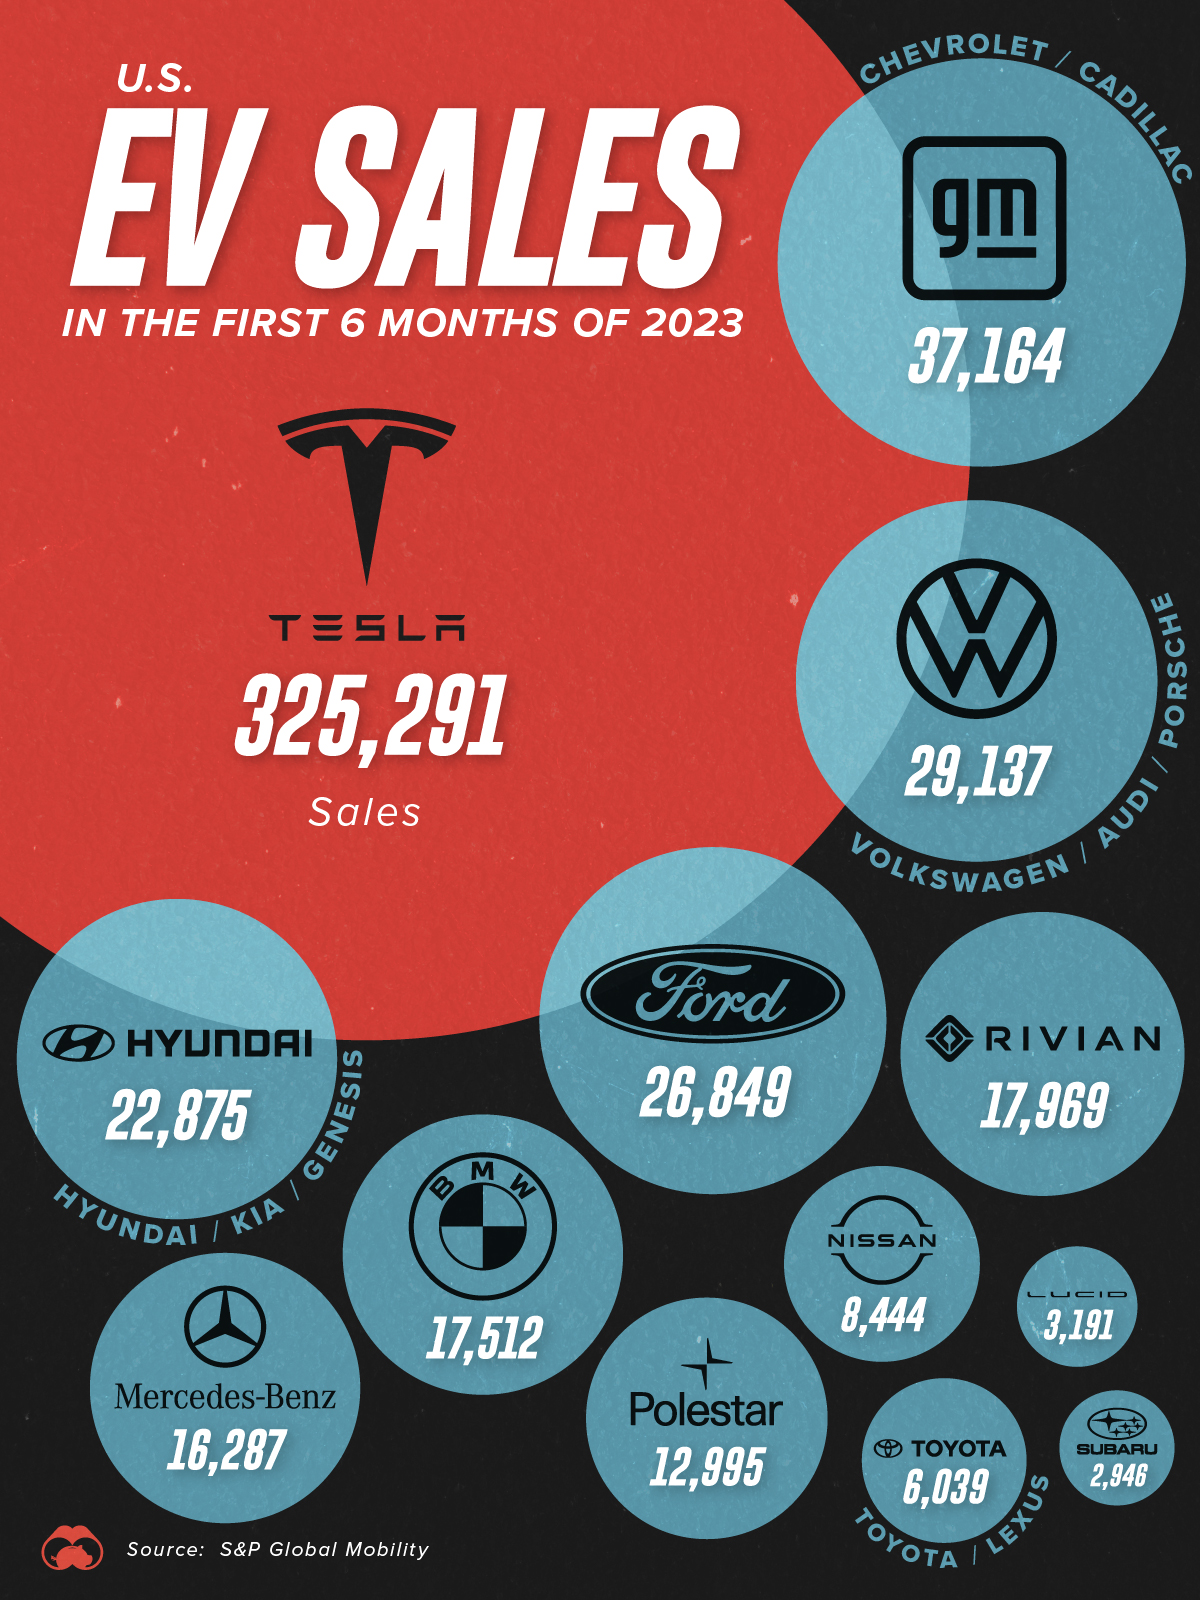
This graphic breaks down the number of EVs each brand sold in the U.S. during the first six months of 2023, from Jan 1 to June 30th.
The main takeaway of this data, which comes from S&P Global Mobility, is that Tesla has outsold all of its rivals combined over the time period. See below for the data in tabular format.
| Automaker | Sales |
|---|---|
| Tesla | 325,291 |
| GM | 37,164 |
| VW Group | 29,137 |
| Ford | 26,849 |
| Hyundai Motor Group | 22,875 |
| Rivian | 17,969 |
| BMW | 17,512 |
| Mercedes-Benz | 16,287 |
| Volvo Polestar | 12,995 |
| Nissan | 8,444 |
| Toyota Motor Corp. | 6,039 |
| Lucid | 3,191 |
| Subaru | 2,946 |
Based on these numbers, Tesla’s H1 2023 sales of 325,291 EVs was 61.5% greater than the collective sales of its competitors (201,408 EVs).
Tesla’s Price War
A key driver of Tesla’s strong performance has been its ability to repeatedly reduce prices on popular models like the Model Y. The price cuts are possible thanks to the company’s relatively strong profit margins, which we covered in a previous graphic.
In that graphic, it was revealed that Tesla earned substantial net profits of $9,574 per vehicle sold, significantly higher than rivals like GM ($2,150), Toyota ($1,197), and Volkswagen ($973).
Tesla’s first round of price cuts came in 2022, with several more following throughout 2023. This has put significant pressure on competitors like Ford, which are already struggling with EV profitability. For example, Ford Model e (Ford’s EV division) has posted losses of $900M in 2021, $2.1B in 2022, and an expected $3B in 2023.
Taking Advantage of Federal EV Credits
Another factor to consider is the Inflation Reduction Act of 2022, which revised tax credits for EVs. In short, EVs (and their batteries) must now be assembled in North America to qualify.
This legislation change has benefitted Tesla, as it means many foreign competitors like VW, BMW, and Hyundai no longer qualify for the credit.
The post Visualizing U.S. EV Sales in H1 2023 appeared first on Visual Capitalist.