
See more visualizations like this on the Voronoi app.
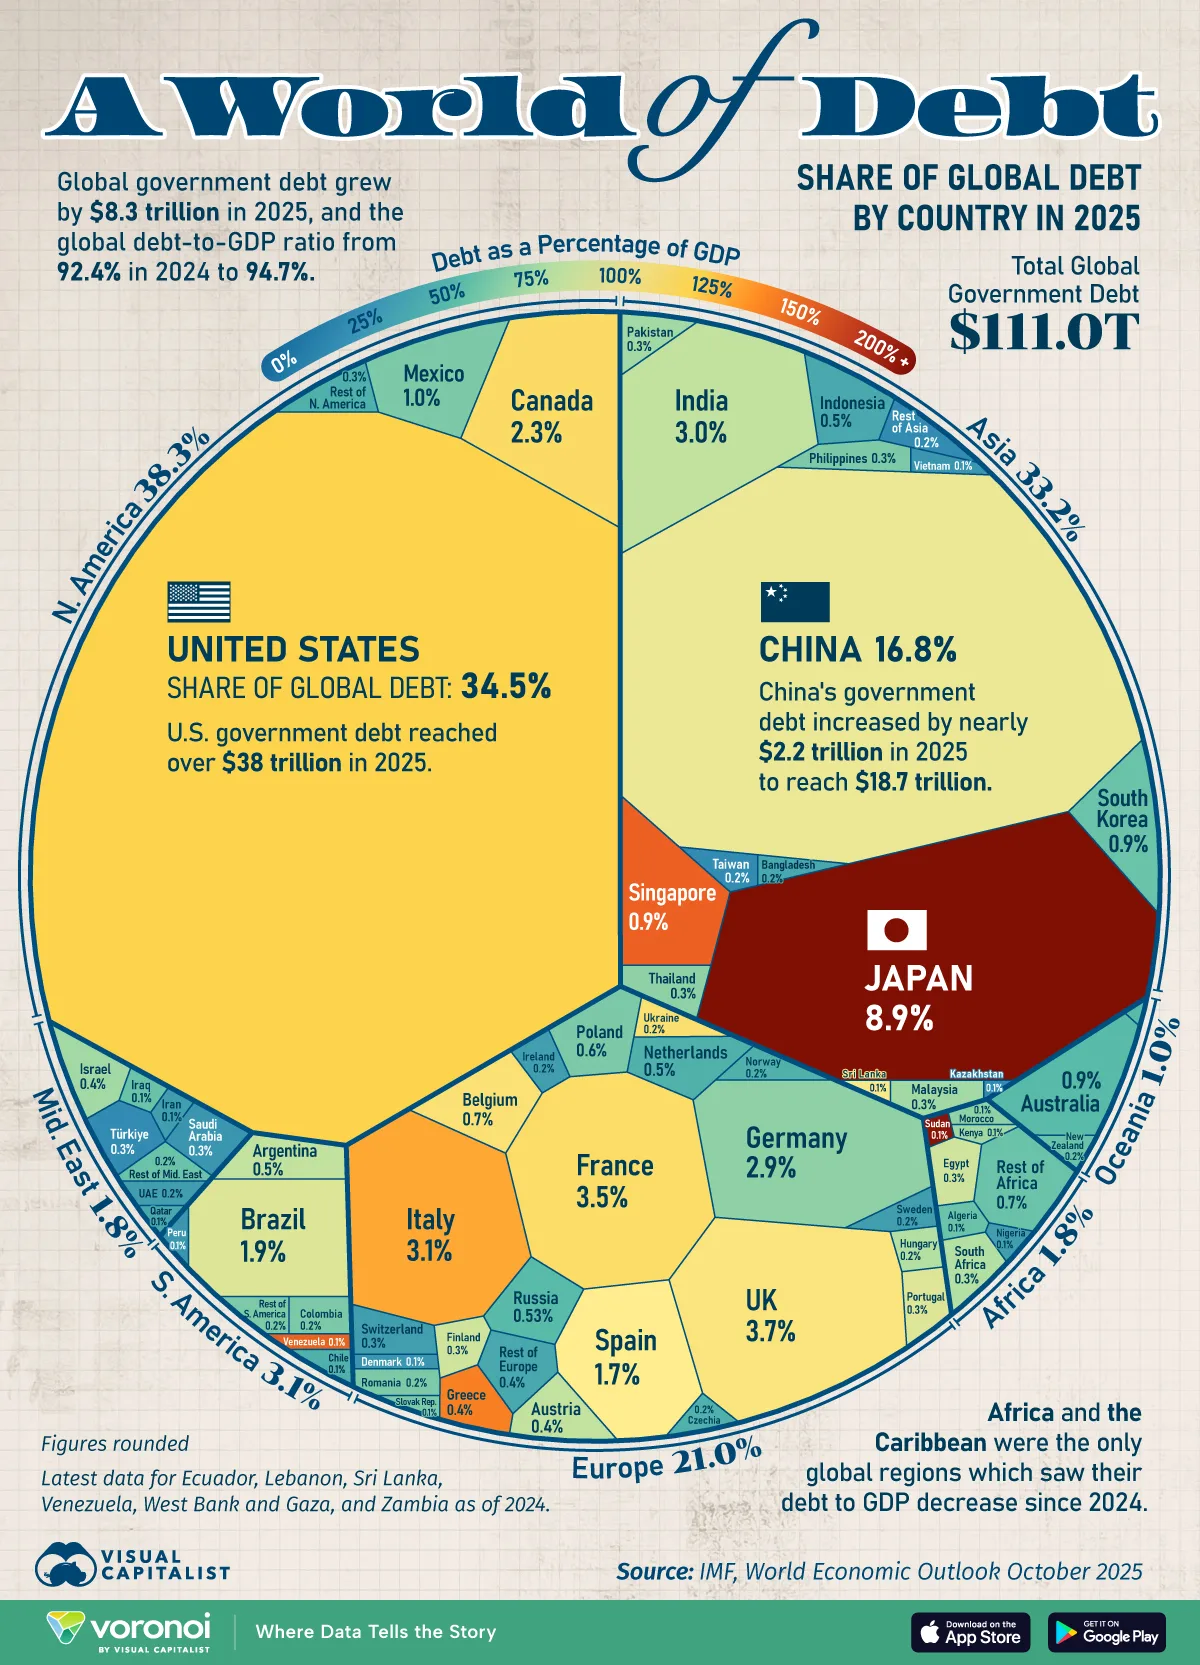
Visualizing World Debt by Country in 2025
See visuals like this from many other data creators on our Voronoi app. Download it for free on iOS or Android and discover incredible data-driven charts from a variety of trusted sources.
Key Takeaways
- Gross public debt stands at $111 trillion globally in 2025, rising by $8.3 trillion since 2024.
- Together, the U.S. and China hold 51.8% of the world’s government debt.
While global public debt is lower than pandemic highs in real terms, it remains stubbornly elevated at $111 trillion.
This graphic shows world debt by country in 2025, based on data from the IMF’s latest World Economic Outlook.
A Closer Look at World Debt by Country
Below, we break down government debt around the world in 2025:
| Country | Share of Global Debt2025 | Value of Debt(Billions USD) | General Government Gross Debt(Percent of GDP) |
|---|---|---|---|
| U.S. | 34.5% | $38,269.7 | 125.0% |
| China | 16.8% | $18,680.8 | 96.3% |
| Japan | 8.9% | $9,826.5 | 229.6% |
| UK | 3.7% | $4,093.4 | 103.4% |
| France | 3.5% | $3,916.2 | 116.5% |
| Italy | 3.1% | $3,479.8 | 136.8% |
| India | 3.0% | $3,357.9 | 81.4% |
| Germany | 2.9% | $3,228.7 | 64.4% |
| Canada | 2.3% | $2,601.0 | 113.9% |
| Brazil | 1.9% | $2,062.8 | 91.4% |
| Spain | 1.7% | $1,898.9 | 100.4% |
| Mexico | 1.0% | $1,097.2 | 58.9% |
| Singapore | 0.9% | $1,008.3 | 175.6% |
| South Korea | 0.9% | $992.5 | 53.4% |
| Australia | 0.8% | $933.0 | 51.0% |
| Belgium | 0.7% | $770.8 | 107.5% |
| Poland | 0.6% | $623.8 | 60.0% |
| Indonesia | 0.5% | $588.8 | 40.8% |
| Russia | 0.5% | $586.9 | 23.1% |
| Netherlands | 0.5% | $581.1 | 44.0% |
| Argentina | 0.5% | $538.5 | 78.8% |
| Austria | 0.4% | $464.5 | 82.0% |
| Israel | 0.4% | $422.6 | 69.2% |
| Greece | 0.4% | $413.7 | 146.7% |
| Türkiye | 0.3% | $380.4 | 24.3% |
| Saudi Arabia | 0.3% | $370.4 | 29.2% |
| Switzerland | 0.3% | $370.0 | 36.9% |
| Thailand | 0.3% | $362.5 | 64.9% |
| Malaysia | 0.3% | $331.3 | 70.4% |
| South Africa | 0.3% | $329.6 | 77.3% |
| Portugal | 0.3% | $307.2 | 90.9% |
| Egypt | 0.3% | $303.9 | 87.0% |
| Pakistan | 0.3% | $293.9 | 71.6% |
| Philippines | 0.3% | $287.6 | 58.2% |
| Finland | 0.2% | $273.2 | 86.8% |
| Romania | 0.2% | $258.6 | 61.2% |
| Colombia | 0.2% | $258.1 | 58.9% |
| Ireland | 0.2% | $233.9 | 33.0% |
| Ukraine | 0.2% | $227.7 | 108.6% |
| Sweden | 0.2% | $226.5 | 34.2% |
| Norway | 0.2% | $220.8 | 42.7% |
| Taiwan | 0.2% | $206.9 | 23.4% |
| UAE | 0.2% | $193.5 | 34.0% |
| Bangladesh | 0.2% | $191.4 | 40.3% |
| Hungary | 0.2% | $185.3 | 74.8% |
| Czech Republic | 0.2% | $168.7 | 44.0% |
| Algeria | 0.1% | $155.5 | 54.0% |
| Vietnam | 0.1% | $155.1 | 32.0% |
| Chile | 0.1% | $148.2 | 42.7% |
| Iraq | 0.1% | $141.0 | 53.1% |
| New Zealand | 0.1% | $139.9 | 53.2% |
| Denmark | 0.1% | $136.0 | 29.6% |
| Venezuela | 0.1% | $136.0 | 164.3% |
| Iran | 0.1% | $126.9 | 35.6% |
| Morocco | 0.1% | $120.7 | 67.2% |
| Nigeria | 0.1% | $103.7 | 36.4% |
| Peru | 0.1% | $102.2 | 32.1% |
| Sri Lanka | 0.1% | $99.8 | 100.8% |
| Kenya | 0.1% | $92.5 | 68.0% |
| Slovak Republic | 0.1% | $92.1 | 59.6% |
| Qatar | 0.1% | $90.2 | 40.6% |
| Sudan | 0.1% | $79.5 | 221.5% |
| Dominican Republic | 0.1% | $77.8 | 60.0% |
| Kazakhstan | 0.1% | $74.4 | 24.8% |
| Angola | 0.1% | $71.9 | 62.4% |
| Ecuador | 0.1% | $70.2 | 53.8% |
| Bahrain | 0.1% | $67.5 | 142.5% |
| Ghana | 0.1% | $66.2 | 59.1% |
| Costa Rica | 0.1% | $61.3 | 59.7% |
| Croatia | 0.1% | $59.2 | 57.0% |
| Uruguay | 0.1% | $56.6 | 66.6% |
| Côte d’Ivoire | 0.05% | $55.2 | 55.6% |
| Panama | 0.05% | $53.9 | 59.6% |
| Bolivia | 0.05% | $53.5 | 93.7% |
| Slovenia | 0.05% | $52.8 | 66.6% |
| Ethiopia | 0.05% | $51.1 | 46.7% |
| Jordan | 0.05% | $50.4 | 89.7% |
| Hong Kong SAR | 0.05% | $50.1 | 11.7% |
| Tunisia | 0.04% | $47.6 | 80.6% |
| Lebanon | 0.04% | $46.3 | 163.8% |
| Senegal | 0.04% | $45.3 | 122.9% |
| Serbia | 0.04% | $43.9 | 43.9% |
| Tanzania | 0.04% | $43.4 | 49.6% |
| Uzbekistan | 0.04% | $42.8 | 31.1% |
| Lithuania | 0.04% | $39.8 | 41.8% |
| Myanmar | 0.03% | $38.5 | 63.5% |
| Oman | 0.03% | $36.9 | 35.1% |
| Bulgaria | 0.03% | $36.3 | 28.4% |
| Uganda | 0.03% | $34.1 | 52.4% |
| Zambia | 0.03% | $33.7 | 114.9% |
| Guatemala | 0.03% | $32.6 | 27.0% |
| Mozambique | 0.03% | $32.4 | 131.1% |
| El Salvador | 0.03% | $32.1 | 87.6% |
| Belarus | 0.03% | $30.7 | 35.8% |
| Luxembourg | 0.02% | $27.3 | 27.1% |
| Zimbabwe | 0.02% | $24.0 | 45.0% |
| Cyprus | 0.02% | $23.0 | 57.7% |
| Cameroon | 0.02% | $23.0 | 37.9% |
| Puerto Rico | 0.02% | $22.8 | 18.0% |
| Latvia | 0.02% | $22.6 | 47.1% |
| Nepal | 0.02% | $22.4 | 49.3% |
| Paraguay | 0.02% | $19.8 | 41.7% |
| Iceland | 0.02% | $18.2 | 47.4% |
| Honduras | 0.02% | $17.8 | 45.1% |
| Azerbaijan | 0.02% | $17.1 | 22.4% |
| Trinidad and Tobago | 0.02% | $17.0 | 65.3% |
| PapuaNew Guinea | 0.01% | $16.5 | 50.4% |
| Gabon | 0.01% | $16.3 | 76.2% |
| Albania | 0.01% | $16.2 | 54.1% |
| DRC | 0.01% | $15.7 | 19.1% |
| Lao P.D.R. | 0.01% | $15.4 | 90.7% |
| Armenia | 0.01% | $14.9 | 53.4% |
| Congo | 0.01% | $14.6 | 93.1% |
| Burkina Faso | 0.01% | $14.3 | 53.2% |
| Mauritius | 0.01% | $13.9 | 88.1% |
| Jamaica | 0.01% | $13.7 | 59.2% |
| Cambodia | 0.01% | $13.6 | 27.8% |
| Malta | 0.01% | $13.0 | 46.9% |
| Georgia | 0.01% | $12.8 | 34.2% |
| Mali | 0.01% | $12.5 | 48.9% |
| Yemen | 0.01% | $12.4 | 71.4% |
| Benin | 0.01% | $12.4 | 50.7% |
| Bahamas | 0.01% | $12.1 | 74.1% |
| Malawi | 0.01% | $12.0 | 80.4% |
| Mongolia | 0.01% | $11.7 | 46.6% |
| Guinea | 0.01% | $11.6 | 42.2% |
| Kuwait | 0.01% | $11.5 | 7.3% |
| Estonia | 0.01% | $11.4 | 24.4% |
| Rwanda | 0.01% | $10.8 | 73.2% |
| Bosnia and Herzegovina | 0.01% | $10.2 | 30.6% |
| Maldives | 0.01% | $10.1 | 131.8% |
| North Macedonia | 0.01% | $9.9 | 52.9% |
| Niger | 0.01% | $9.7 | 42.2% |
| Madagascar | 0.01% | $9.6 | 49.7% |
| Namibia | 0.01% | $9.3 | 63.6% |
| West Bankand Gaza | 0.01% | $9.0 | 65.6% |
| Nicaragua | 0.01% | $8.1 | 39.3% |
| Togo | 0.01% | $7.9 | 71.9% |
| Kyrgyz Republic | 0.01% | $7.6 | 37.8% |
| Barbados | 0.01% | $7.5 | 99.8% |
| Botswana | 0.01% | $7.4 | 38.8% |
| Moldova | 0.01% | $7.4 | 37.8% |
| Guyana | 0.01% | $7.3 | 29.0% |
| Chad | 0.01% | $6.8 | 31.5% |
| Montenegro | 0.01% | $5.7 | 60.8% |
| Equatorial Guinea | 0.004% | $4.9 | 36.6% |
| Mauritania | 0.004% | $4.9 | 41.2% |
| Fiji | 0.004% | $4.9 | 76.6% |
| Suriname | 0.004% | $4.0 | 89.1% |
| Tajikistan | 0.003% | $3.7 | 22.0% |
| Haiti | 0.003% | $3.6 | 11.8% |
| Bhutan | 0.003% | $3.6 | 105.6% |
| Sierra Leone | 0.003% | $3.6 | 41.2% |
| South Sudan | 0.003% | $3.3 | 66.0% |
| Cabo Verde | 0.003% | $3.1 | 106.0% |
| Aruba | 0.003% | $2.9 | 67.1% |
| Liberia | 0.003% | $2.9 | 55.7% |
| Burundi | 0.003% | $2.8 | 40.3% |
| Turkmenistan | 0.003% | $2.8 | 3.9% |
| Kosovo | 0.002% | $2.2 | 17.6% |
| Eswatini | 0.002% | $2.2 | 42.8% |
| Belize | 0.002% | $2.1 | 64.7% |
| Saint Lucia | 0.002% | $2.0 | 77.0% |
| Guinea-Bissau | 0.002% | $1.9 | 76.2% |
| Central African Republic | 0.002% | $1.9 | 57.1% |
| Gambia | 0.002% | $1.9 | 74.4% |
| Antigua and Barbuda | 0.001% | $1.5 | 65.7% |
| Djibouti | 0.001% | $1.4 | 30.5% |
| San Marino | 0.001% | $1.4 | 62.7% |
| Andorra | 0.001% | $1.4 | 31.7% |
| Lesotho | 0.001% | $1.4 | 57.1% |
| Seychelles | 0.001% | $1.3 | 56.7% |
| Saint Vincent and the Grenadines | 0.001% | $1.2 | 94.0% |
| Grenada | 0.001% | $1.0 | 67.7% |
| Dominica | 0.001% | $0.7 | 95.7% |
| Saint Kitts and Nevis | 0.001% | $0.7 | 61.9% |
| Vanuatu | 0.0005% | $0.5 | 48.6% |
| São Tomé and Príncipe | 0.0005% | $0.5 | 51.4% |
| Comoros | 0.0004% | $0.5 | 30.2% |
| Solomon Islands | 0.0004% | $0.5 | 23.7% |
| Brunei Darussalam | 0.0003% | $0.4 | 2.3% |
| Timor-Leste | 0.0003% | $0.3 | 13.9% |
| Samoa | 0.0002% | $0.3 | 20.9% |
| Palau | 0.0002% | $0.2 | 63.1% |
| Tonga | 0.0002% | $0.2 | 31.6% |
| Liechtenstein | 0.00004% | $0.047 | 0.5% |
| Micronesia | 0.00004% | $0.046 | 9.3% |
| Marshall Islands | 0.00003% | $0.032 | 10.6% |
| Kiribati | 0.00003% | $0.028 | 8.7% |
| Nauru | 0.00002% | $0.026 | 15.0% |
| Tuvalu | 0.000002% | $0.002 | 3.6% |
| Macao SAR | 0.0% | $0.000 | 0.0% |
| World | 100.0% | $110,955.6 | 94.7% |
America’s debt burden exceeds $38 trillion in 2025, standing at 125% of GDP.
Over the past five years, net interest payments on the national debt have nearly tripled. They are projected to double again by 2035 to reach $1.8 trillion per year.
With $18.7 trillion in debt, China ranks in second. In 2025, debt expanded by almost $2.2 trillion, driven by government stimulus and weaker land revenues given a struggling property market sector.
As we can see, Japan follows next with a $9.8 trillion debt pile, equal to 230% of GDP. Even though debt remains sky-high, the country’s new prime minister, Sanae Takaichi, is proposing $92.2 billion in stimulus spending and subsidies.
The UK and France round out the top largest debt burdens, both hovering near $4 trillion. France, in particular, has experienced significant political instability amid contentious budget cut proposals, cycling through five prime ministers over the past two years.
Learn More on the Voronoi App
To learn more about this topic, check out this graphic on government debt to GDP around the world.