![]()
See this visualization first on the Voronoi app.
Use This Visualization
Visualized: Desktop vs. Mobile Global Web Traffic Over Time
This was originally posted on our Voronoi app. Download the app for free on iOS or Android and discover incredible data-driven charts from a variety of trusted sources.
Key Takeaways
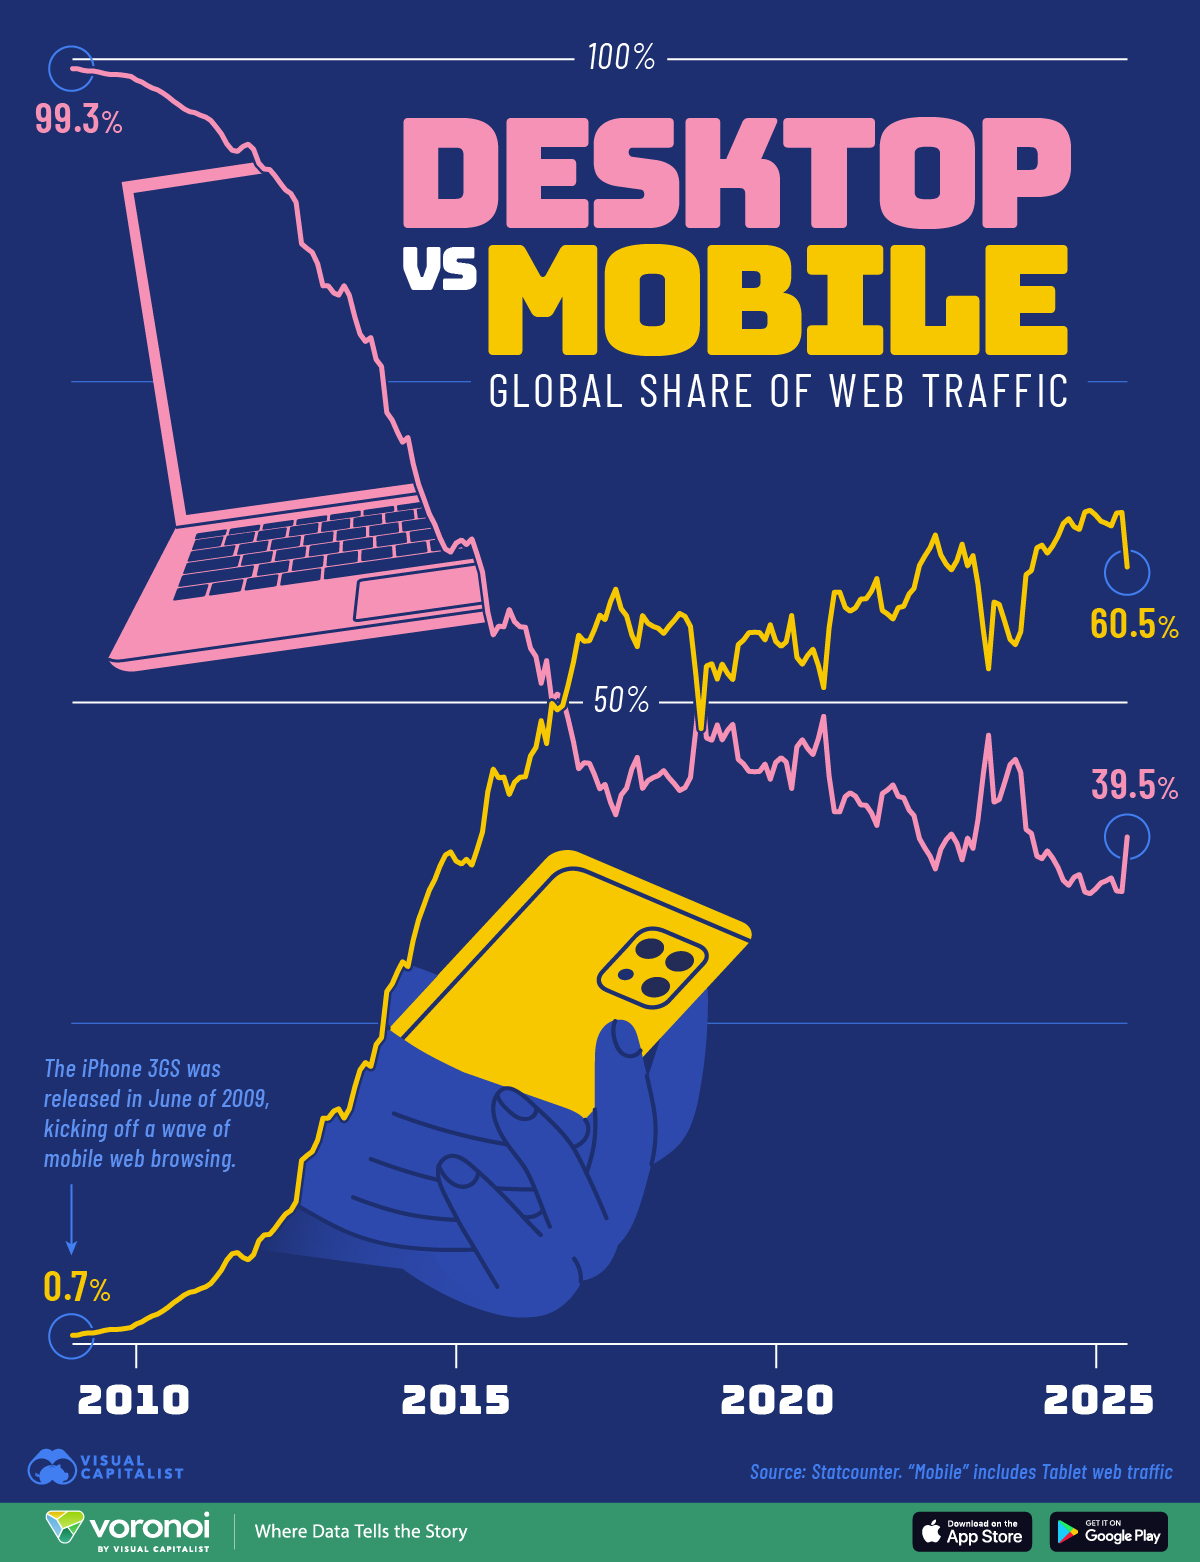
- In January 2009, desktop devices accounted for 99.3% of global web traffic, while mobile devices made up just 0.7%.
- By October 2016, mobile traffic overtook desktop for the first time, marking a pivotal shift in how people access the internet.
- As of July 2025, mobile accounts for 60.5% of global web traffic, compared to 39.5% for desktop, signaling the enduring dominance of mobile-first browsing in the post-smartphone era.
The way people access and browse the internet has changed dramatically over the past two decades.
Mobile internet usage on smartphones and tablets has surged from a minor share of web traffic to becoming the dominant access method worldwide. The data also reflects technological advances, shifting user behavior, and the widespread adoption of smartphones.
This visualization uses the latest data from Statcounter to show the global monthly share of web traffic split between desktop and mobile platforms over the previous 16 years, with the mobile category including tablets.
Desktop Web Browsing Dominance at the Start
This table compares global web traffic by platform, desktop vs. mobile, from 2009 to 2025, with 2025’s data as of July.
| Year | Desktop share of global web browsing (%) | Mobile share of global web browsing (%) |
|---|---|---|
| 2009 | 99.3% | 0.7% |
| 2010 | 98.4% | 1.6% |
| 2011 | 95.7% | 4.3% |
| 2012 | 91.5% | 8.5% |
| 2013 | 82.4% | 17.6% |
| 2014 | 72.0% | 28.1% |
| 2015 | 62.4% | 37.6% |
| 2016 | 55.9% | 44.1% |
| 2017 | 45.3% | 54.7% |
| 2018 | 43.9% | 56.1% |
| 2019 | 47.0% | 53.0% |
| 2020 | 45.3% | 54.7% |
| 2021 | 41.5% | 58.6% |
| 2022 | 42.5% | 57.5% |
| 2023 | 39.4% | 60.6% |
| 2024 | 39.8% | 60.2% |
| 2025 | 39.5% | 60.5% |
In January 2009, desktop computers accounted for a staggering 99.3% of global web traffic. Mobile phones made up just 0.7%. At the time, smartphones were still a novelty, and most internet use happened on personal computers.
Laptops and desktops were essential tools for online activity, whether at work or home. Mobile devices were limited by data speeds, small screens, and app ecosystems that were still evolving.
The Mobile Crossover Point in Web Traffic
By October 2016, mobile traffic surpassed desktop for the first time, marking a significant turning point. This shift coincided with the rise of faster mobile networks, cheaper smartphones, and more responsive web design.
Apps and mobile-first platforms like Instagram, TikTok, and WhatsApp also played a role in driving mobile usage.
Many users in emerging markets skipped desktops altogether, going online for the first time via mobile.
Mobile’s Ongoing Web Browsing Dominance
As of July 2025, mobile accounts for 60.5% of global web traffic, while desktop has dropped to 39.5%. The dominance of mobile is firm in regions like Asia and Africa, where mobile-first experiences are standard.
Even in developed markets, mobile usage continues to expand thanks to 5G networks and enhanced mobile integrations and applications.
Desktop still holds ground in workplaces and for specific tasks, but the trend is clear—mobile internet browsing is the future.
Learn More on the Voronoi App ![]()
If you enjoyed this post, check out The Most Popular Phone Brands in the U.S. on Voronoi, the new app from Visual Capitalist.