![]()
See this visualization first on the Voronoi app.
Use This Visualization
Mapped: Population that Can’t Afford a Healthy Diet by Region
This was originally posted on our Voronoi app. Download the app for free on iOS or Android and discover incredible data-driven charts from a variety of trusted sources.
Key Takeaways
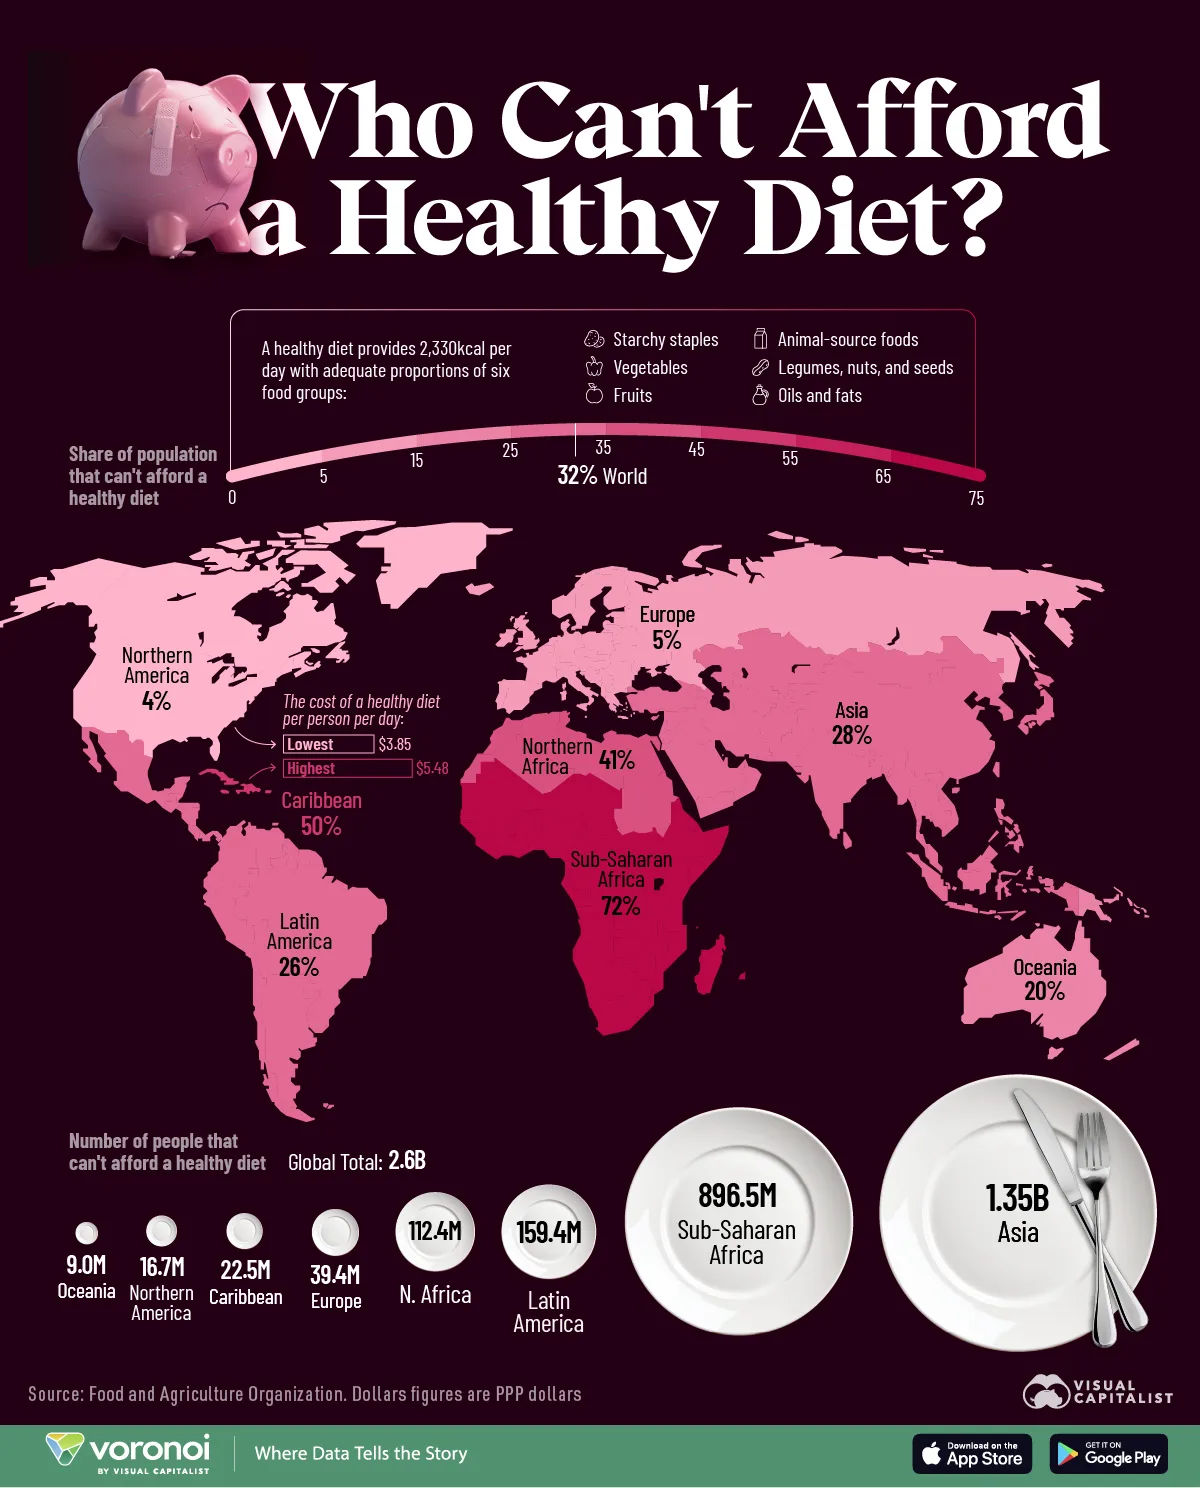
- Sub-Saharan Africa faces the highest burden, with 72% of its population—896.5 million people—unable to afford a healthy diet.
- Asia accounts for the largest absolute number with 1.35 billion people, representing 28% of its population.
Over 2.6 billion people globally—nearly one-third of the population—cannot afford a healthy diet, according to the latest data from the UN Food and Agriculture Organization (FAO).
This visualization breaks down both the share and the number of people unable to afford a healthy diet by region in 2024 using the latest data available as of September 2025 from the FAO.
Regions with the Most People Unable to Afford a Healthy Diet
The UN Food and Agriculture Organization defines a healthy diet as one that provides 2,330 kcal per day, with adequate nutritional proportions of six major food groups:
- Starchy staples (e.g., rice and potatoes)
- Vegetables
- Fruits
- Animal-source foods (e.g., meat, dairy, eggs)
- Oils and fats
- Legumes, nuts and seeds.
The data table below shows the data for each region’s share and number of people who are not able to afford a healthy diet:
| Region | Can't afford a healthy diet | Share |
|---|---|---|
| Asia | 1,350,000,000 | 28.1% |
| Sub-Saharan Africa | 896,500,000 | 72.1% |
| Latin America | 159,400,000 | 26.1% |
| Northern Africa | 112,400,000 | 41.3% |
| Europe | 39,400,000 | 5.3% |
| Caribbean | 22,500,000 | 50.1% |
| Northern America | 16,700,000 | 4.3% |
| Oceania | 9,000,000 | 19.6% |
| World | 2,600,000,000 | 31.9% |
Asia has the highest number of people unable to afford a healthy diet at 1.35 billion, despite having a relatively lower share (28%) of its population unable to afford a healthy diet. This is due to the region’s large population base.
Sub-Saharan Africa, by contrast, faces the highest proportional burden, with over 72% of its population (896.5 million people) unable to meet the cost of a healthy diet. Latin America also has a substantial number at 159.4 million, representing about 26% of its population.
In absolute terms, Europe (39.4 million) and Northern America (16.7 million) are far lower, but they still represent millions who are nutritionally vulnerable despite higher average income levels.
The Cost of a Healthy Diet Varies Across Regions
The average cost of a healthy diet is a key factor that differs notably between regions and affects food affordability and security.
The data table below shows the cost of a healthy diet per person per day for every region:
| Region | Average dollar cost per person per day for a healthy diet |
|---|---|
| Caribbean | $5.48 |
| Latin America | $4.87 |
| Northern Africa | $4.76 |
| Asia | $4.43 |
| Sub-Saharan Africa | $4.37 |
| Europe | $4.03 |
| Oceania | $3.86 |
| Northern America | $3.85 |
| World | $4.46 |
The Caribbean tops the list at $5.48 per day, followed by Latin America at $4.87. These higher costs likely reflect greater reliance on imports and smaller economies of scale.
Sub-Saharan Africa, despite having a lower cost at $4.37, still sees the highest proportion of people unable to afford it.
Meanwhile, Northern America, Europe, and Oceania have the lowest costs ranging from $3.85 to $4.03, and as a result have the lowest proportion of their populations unable to afford a healthy diet.
Learn More on the Voronoi App ![]()
To learn more about food affordability and security, check out this graphic which breaks down the countries that are able to feed themselves across seven food groups on Voronoi, the new app from Visual Capitalist.