![]()
See more visualizations like this on the Voronoi app.
Use This Visualization
The State of U.S. Household Finances in 2025
See visuals like this from many other data creators on our Voronoi app. Download it for free on iOS or Android and discover incredible data-driven charts from a variety of trusted sources.
Key Takeaways
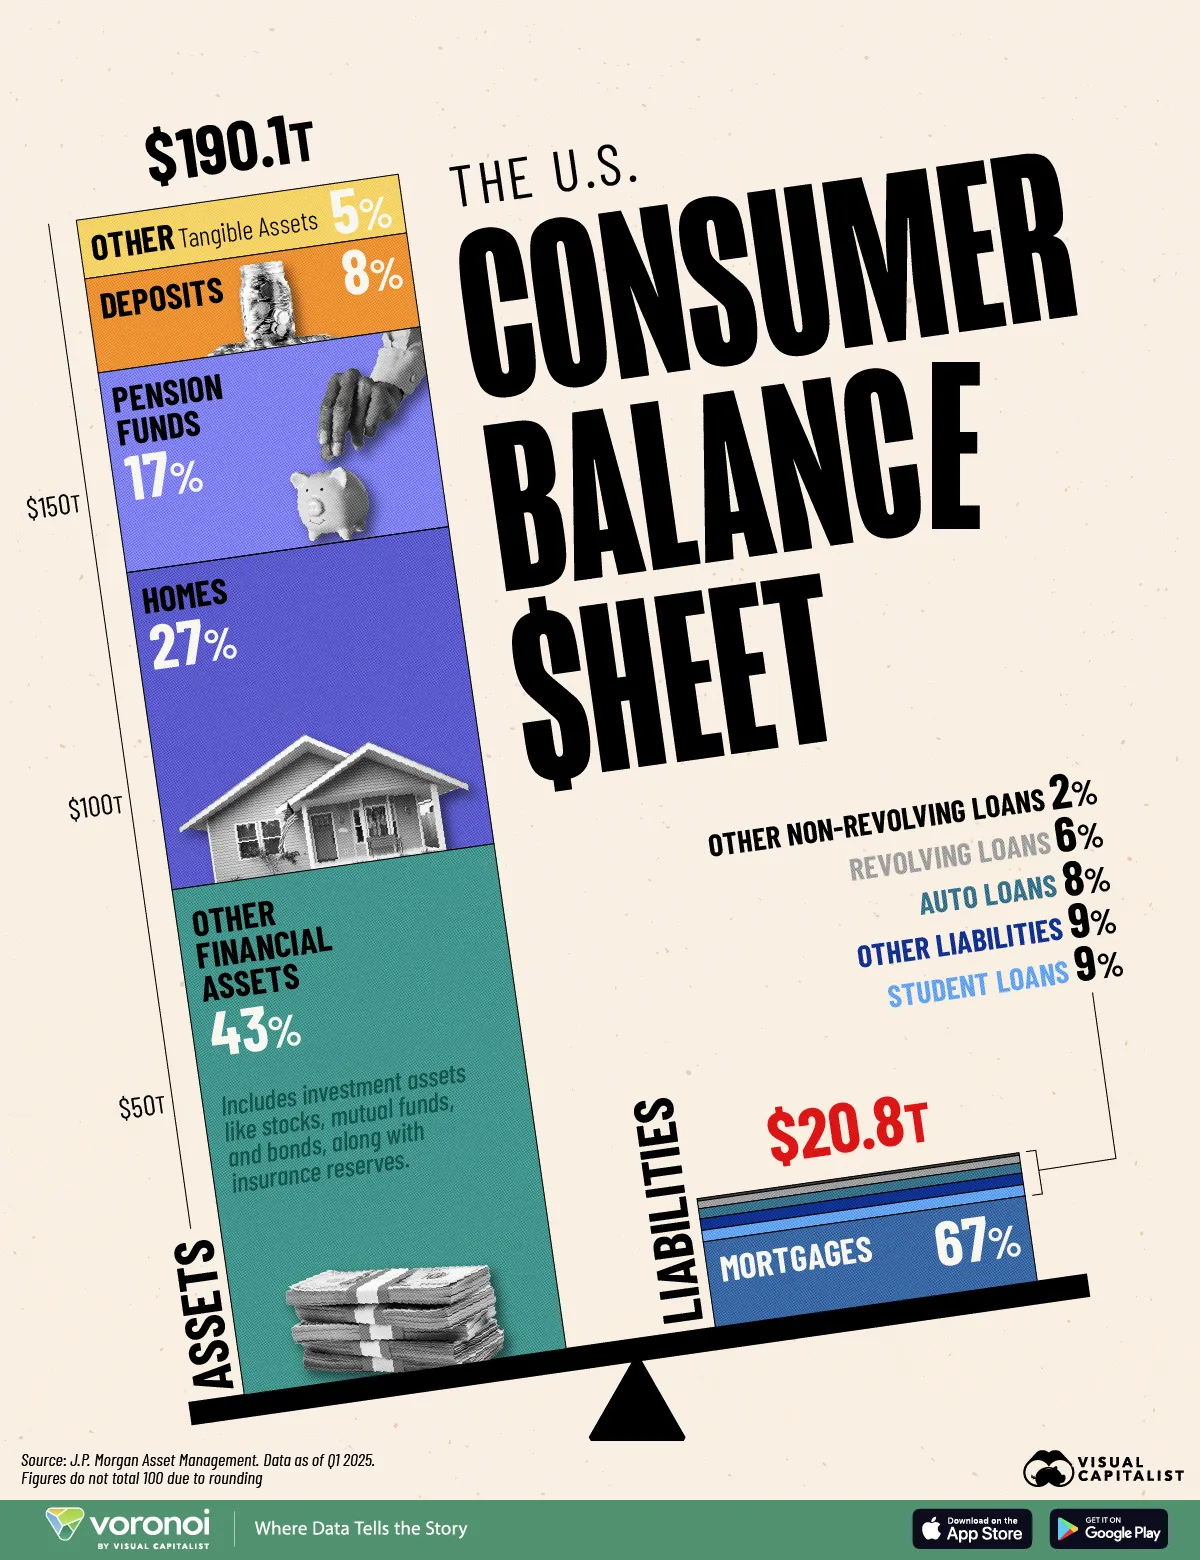
- U.S. households held $190.1 trillion in assets and $20.8 trillion in debt in Q1 2025.
- Financial assets, such as stocks and ETFs, stood as the largest share of assets, accounting for 43% of the total.
The resilience of the U.S. consumer is a core driver of economic health at a time of trade uncertainty and broader economic ambiguity.
But how do the different components of consumer wealth and debt really break down as a whole? And what can these figures tell us about the financial health of American households?
This graphic shows U.S. household finances in Q1 2025, based on data from J.P. Morgan Asset Management.
U.S. Household Finances: Assets in Q1
Below, we show $190.1 trillion in U.S. consumer assets:
| Assets | Percentage of Total Q1 2025 |
|---|---|
| Other financial assets | 43% |
| Homes | 27% |
| Pension funds | 17% |
| Deposits | 8% |
| Other tangible assets | 5% |
| Total | $190.1T |
Figures do not total 100 due to rounding
‘Other financial assets’, such as stocks, account for nearly half of all wealth—roughly equal to residential assets and pension funds combined.
Notably, direct and indirect stock ownership as a share of household financial assets stands at an all-time high, bolstered by a strong stock market. Meanwhile, residential assets accounted for 27% of consumer wealth, the second-highest overall.
Deposits totaled 8%, as bank balances fall below historical trends, perhaps indicating that consumers are instead putting cash reserves into other types of assets, such as stocks.
U.S. Household Finances: Liabilities in Q1
The following table shows that U.S. households held $20.8 trillion in liabilities, with mortgages accounting for about two-thirds of the total.
| Liabilities | Percentage of Total Q1 2025 |
|---|---|
| Mortgages | 67% |
| Student loans | 9% |
| Other liabilities | 9% |
| Auto loans | 8% |
| Revolving(includes credit cards) | 6% |
| Other non-revolving | 2% |
| Total | $20.8T |
Figures do not total 100 due to rounding
Following next in line was student debt, which reached $1.6 trillion in Q2 2025.
As we can see, auto loans made up an 8% share, with delinquencies on the rise in recent months as higher living costs and inflation taking a toll on consumer finances. Today, delinquencies stand at 5%, the highest level in at least five years.
Learn More on the Voronoi App ![]()
To learn more about this topic, check out this graphic on U.S. household wealth by generation in 2025.