Published
9 minutes ago
on
November 8, 2025
| 1,601 views
-->
By
Ryan Bellefontaine
Graphics & Design
- Athul Alexander
The following content is sponsored by BullionVault
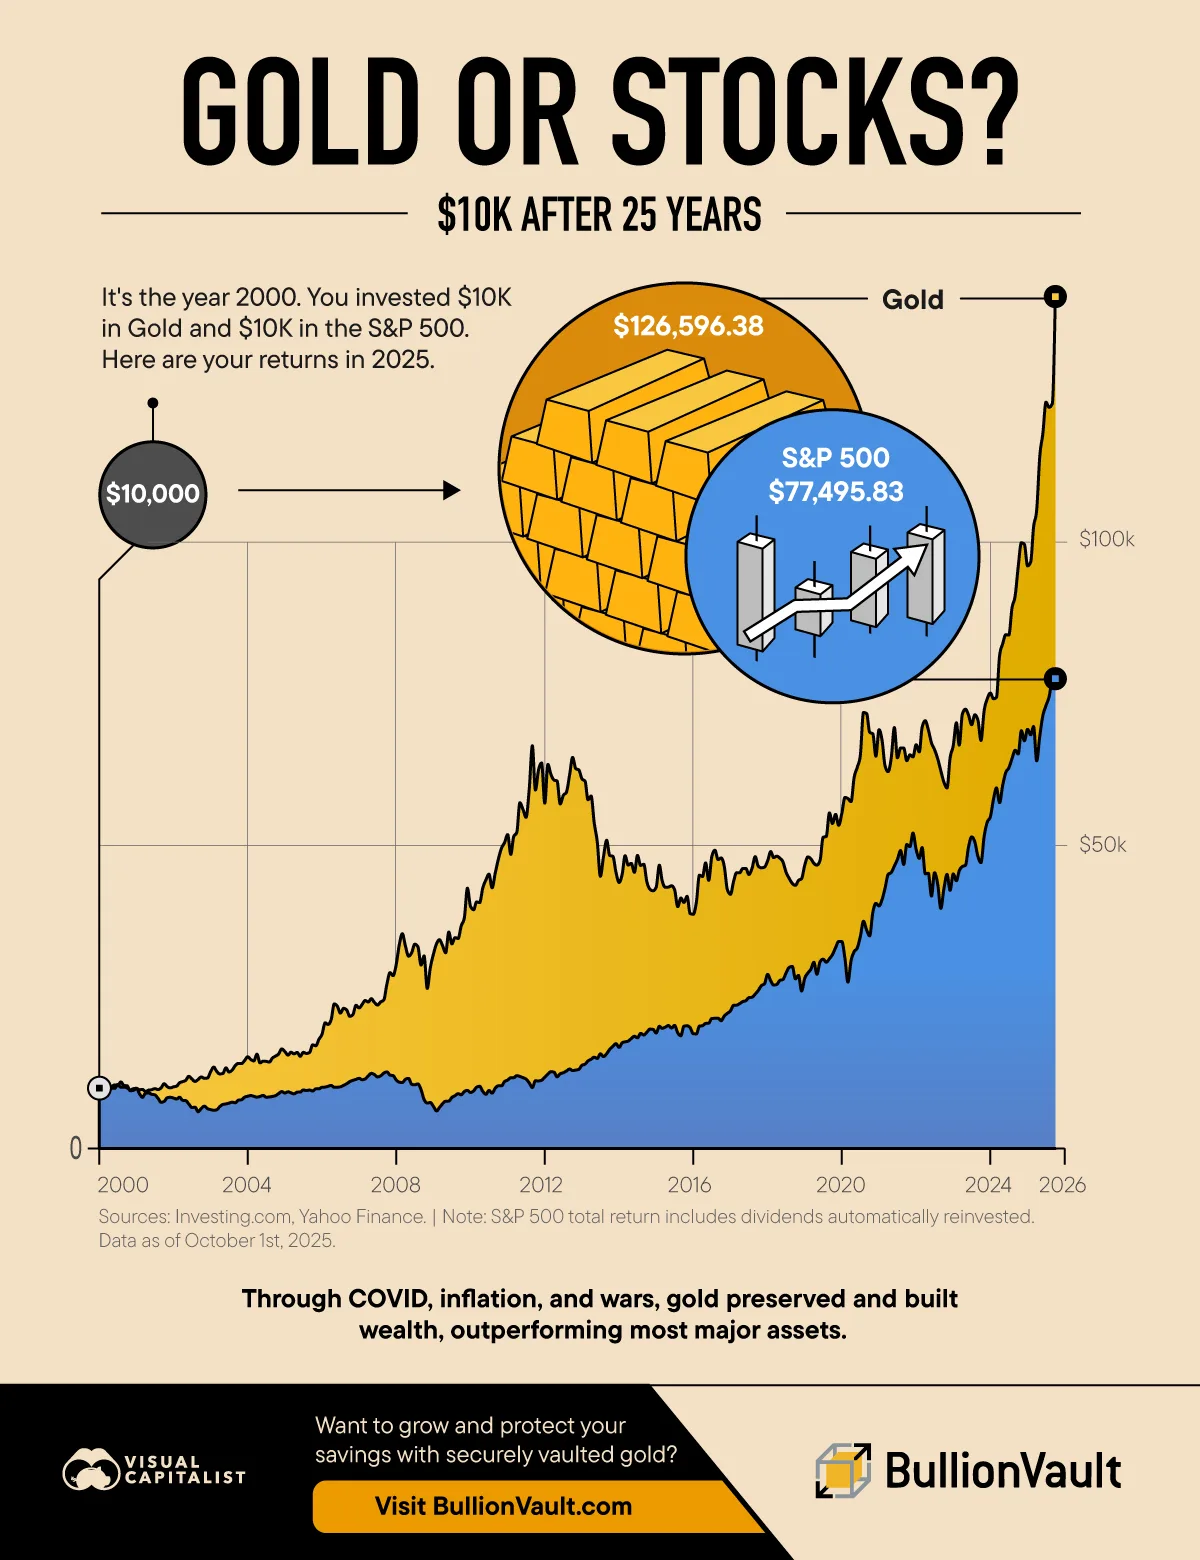
Gold or Stocks? $10K After 25 Years
Key Takeaways
- Over 25 years, gold turned $10K into $127K, outpacing the S&P 500 TR at $77K.
- Inflation spikes and policy uncertainty boosted gold’s role as a store of value.
- Fewer deep setbacks helped gold maintain its lead through multiple crises.
Investors keep asking a simple question: gold or stocks? Since 2000, a generation of crises, inflation spikes, and policy shifts has tested both.
This graphic, created in partnership with BullionVault, shows how a $10K stake in gold and a $10K stake in the S&P 500 grew from January 2000 to October 2025, using data from Investing.com and Yahoo! Finance.
How $10K Grew Through Cycles
By the latest data, $10K in gold finished at $126,596.38, while $10K in the S&P 500 TR ended at $77,495.83. As a result, gold compounded at 10.4% annually, compared to 8.3% for stocks over the same span.
Here is a table that shows the month-by-month investment values for gold and the S&P 500 Total Return since January 2000.
| Date | Investment Value (Gold) | Investment Value (S&P TR) |
|---|---|---|
| 2000-01-01 | $10,000.00 | $10,000.00 |
| 2000-02-01 | $10,313.88 | $9,810.71 |
| 2000-03-01 | $10,637.61 | $10,770.48 |
| 2000-04-01 | $10,158.02 | $10,446.44 |
| 2000-05-01 | $9,959.56 | $10,232.10 |
| 2000-06-01 | $9,910.40 | $10,484.36 |
| 2000-07-01 | $10,564.05 | $10,320.44 |
| 2000-08-01 | $10,096.12 | $10,961.49 |
| 2000-09-01 | $10,114.32 | $10,382.79 |
| 2000-10-01 | $9,986.87 | $10,338.93 |
| 2000-11-01 | $9,651.85 | $9,523.81 |
| 2000-12-01 | $9,844.85 | $9,570.43 |
| 2001-01-01 | $9,919.50 | $9,909.94 |
| 2001-02-01 | $9,680.98 | $9,006.38 |
| 2001-03-01 | $9,731.96 | $8,435.81 |
| 2001-04-01 | $9,393.30 | $9,091.33 |
| 2001-05-01 | $9,615.44 | $9,152.27 |
| 2001-06-01 | $9,688.27 | $8,929.49 |
| 2001-07-01 | $9,863.06 | $8,841.62 |
| 2001-08-01 | $9,717.40 | $8,288.09 |
| 2001-09-01 | $9,994.15 | $7,618.81 |
| 2001-10-01 | $10,667.83 | $7,764.08 |
| 2001-11-01 | $10,183.51 | $8,359.65 |
| 2001-12-01 | $9,992.33 | $8,432.89 |
| 2002-01-01 | $10,158.02 | $8,309.81 |
| 2002-02-01 | $10,281.83 | $8,149.59 |
| 2002-03-01 | $10,813.50 | $8,456.07 |
| 2002-04-01 | $11,022.88 | $7,943.37 |
| 2002-05-01 | $11,228.63 | $7,884.88 |
| 2002-06-01 | $11,891.39 | $7,323.21 |
| 2002-07-01 | $11,456.95 | $6,752.33 |
| 2002-08-01 | $11,053.84 | $6,796.71 |
| 2002-09-01 | $11,388.86 | $6,058.00 |
| 2002-10-01 | $11,789.42 | $6,591.23 |
| 2002-11-01 | $11,572.75 | $6,979.18 |
| 2002-12-01 | $11,618.27 | $6,569.19 |
| 2003-01-01 | $12,636.08 | $6,397.10 |
| 2003-02-01 | $13,418.28 | $6,301.10 |
| 2003-03-01 | $12,739.86 | $6,362.30 |
| 2003-04-01 | $12,289.40 | $6,886.36 |
| 2003-05-01 | $12,367.33 | $7,249.15 |
| 2003-06-01 | $13,290.82 | $7,341.65 |
| 2003-07-01 | $12,614.23 | $7,471.09 |
| 2003-08-01 | $12,927.40 | $7,616.78 |
| 2003-09-01 | $13,676.46 | $7,535.89 |
| 2003-10-01 | $14,028.96 | $7,962.23 |
| 2003-11-01 | $13,998.01 | $8,032.28 |
| 2003-12-01 | $14,488.88 | $8,453.52 |
| 2004-01-01 | $15,114.13 | $8,608.69 |
| 2004-02-01 | $14,659.67 | $8,728.33 |
| 2004-03-01 | $14,436.81 | $8,596.65 |
| 2004-04-01 | $15,535.46 | $8,461.69 |
| 2004-05-01 | $14,114.53 | $8,577.80 |
| 2004-06-01 | $14,402.21 | $8,744.63 |
| 2004-07-01 | $14,361.43 | $8,455.18 |
| 2004-08-01 | $14,247.45 | $8,489.41 |
| 2004-09-01 | $14,923.68 | $8,581.34 |
| 2004-10-01 | $15,230.66 | $8,712.44 |
| 2004-11-01 | $15,604.64 | $9,064.97 |
| 2004-12-01 | $16,418.89 | $9,373.44 |
| 2005-01-01 | $15,966.25 | $9,144.93 |
| 2005-02-01 | $15,389.79 | $9,337.39 |
| 2005-03-01 | $15,863.19 | $9,172.07 |
| 2005-04-01 | $15,602.10 | $8,998.09 |
| 2005-05-01 | $15,836.25 | $9,284.42 |
| 2005-06-01 | $15,197.89 | $9,297.60 |
| 2005-07-01 | $15,849.72 | $9,643.36 |
| 2005-08-01 | $15,665.82 | $9,555.38 |
| 2005-09-01 | $15,849.72 | $9,632.73 |
| 2005-10-01 | $17,084.19 | $9,472.14 |
| 2005-11-01 | $16,940.35 | $9,830.40 |
| 2005-12-01 | $17,983.65 | $9,833.84 |
| 2006-01-01 | $18,848.51 | $10,094.23 |
| 2006-02-01 | $20,718.43 | $10,121.62 |
| 2006-03-01 | $20,456.24 | $10,247.62 |
| 2006-04-01 | $21,253.74 | $10,385.19 |
| 2006-05-01 | $23,833.75 | $10,086.31 |
| 2006-06-01 | $23,440.47 | $10,099.96 |
| 2006-07-01 | $22,326.16 | $10,162.31 |
| 2006-08-01 | $23,108.36 | $10,404.10 |
| 2006-09-01 | $22,828.69 | $10,672.19 |
| 2006-10-01 | $21,787.22 | $11,019.93 |
| 2006-11-01 | $22,089.46 | $11,229.53 |
| 2006-12-01 | $23,607.98 | $11,387.04 |
| 2007-01-01 | $23,189.20 | $11,559.24 |
| 2007-02-01 | $23,786.41 | $11,333.13 |
| 2007-03-01 | $24,396.37 | $11,459.91 |
| 2007-04-01 | $24,165.13 | $11,967.56 |
| 2007-05-01 | $24,698.61 | $12,385.15 |
| 2007-06-01 | $24,068.63 | $12,179.40 |
| 2007-07-01 | $23,657.14 | $11,801.76 |
| 2007-08-01 | $24,161.49 | $11,978.65 |
| 2007-09-01 | $24,507.43 | $12,426.66 |
| 2007-10-01 | $27,096.56 | $12,624.33 |
| 2007-11-01 | $28,993.79 | $12,096.53 |
| 2007-12-01 | $28,509.47 | $12,012.62 |
| 2008-01-01 | $30,355.72 | $11,292.09 |
| 2008-02-01 | $33,706.64 | $10,925.29 |
| 2008-03-01 | $35,413.06 | $10,878.09 |
| 2008-04-01 | $33,345.41 | $11,407.88 |
| 2008-05-01 | $31,715.82 | $11,555.65 |
| 2008-06-01 | $32,296.65 | $10,581.45 |
| 2008-07-01 | $33,687.71 | $10,492.49 |
| 2008-08-01 | $33,278.04 | $10,644.27 |
| 2008-09-01 | $30,253.75 | $9,695.81 |
| 2008-10-01 | $31,752.24 | $8,067.39 |
| 2008-11-01 | $26,402.85 | $7,488.54 |
| 2008-12-01 | $29,769.43 | $7,568.23 |
| 2009-01-01 | $32,052.67 | $6,930.32 |
| 2009-02-01 | $33,784.21 | $6,192.39 |
| 2009-03-01 | $34,417.83 | $6,734.83 |
| 2009-04-01 | $33,434.62 | $7,379.42 |
| 2009-05-01 | $32,282.08 | $7,792.16 |
| 2009-06-01 | $35,686.90 | $7,807.63 |
| 2009-07-01 | $33,751.43 | $8,398.15 |
| 2009-08-01 | $34,767.42 | $8,701.35 |
| 2009-09-01 | $34,636.32 | $9,026.06 |
| 2009-10-01 | $36,695.60 | $8,858.39 |
| 2009-11-01 | $38,050.25 | $9,389.74 |
| 2009-12-01 | $42,928.07 | $9,571.11 |
| 2010-01-01 | $39,918.35 | $9,226.81 |
| 2010-02-01 | $39,384.87 | $9,512.62 |
| 2010-03-01 | $40,657.58 | $10,086.67 |
| 2010-04-01 | $40,559.26 | $10,245.91 |
| 2010-05-01 | $42,942.63 | $9,427.76 |
| 2010-06-01 | $44,288.54 | $8,934.23 |
| 2010-07-01 | $45,240.43 | $9,560.17 |
| 2010-08-01 | $43,002.72 | $9,128.63 |
| 2010-09-01 | $45,433.43 | $9,943.28 |
| 2010-10-01 | $47,685.71 | $10,321.64 |
| 2010-11-01 | $49,508.30 | $10,322.94 |
| 2010-12-01 | $50,429.60 | $11,012.84 |
| 2011-01-01 | $51,762.40 | $11,273.86 |
| 2011-02-01 | $48,511.98 | $11,660.09 |
| 2011-03-01 | $51,405.53 | $11,664.72 |
| 2011-04-01 | $52,146.58 | $12,010.17 |
| 2011-05-01 | $57,011.65 | $11,874.22 |
| 2011-06-01 | $55,910.09 | $11,676.29 |
| 2011-07-01 | $54,626.45 | $11,438.87 |
| 2011-08-01 | $59,234.43 | $10,817.46 |
| 2011-09-01 | $66,414.06 | $10,057.04 |
| 2011-10-01 | $59,129.19 | $11,156.19 |
| 2011-11-01 | $62,461.18 | $11,131.55 |
| 2011-12-01 | $63,570.03 | $11,245.42 |
| 2012-01-01 | $56,964.31 | $11,749.36 |
| 2012-02-01 | $63,341.70 | $12,257.43 |
| 2012-03-01 | $61,731.06 | $12,660.79 |
| 2012-04-01 | $60,773.34 | $12,581.36 |
| 2012-05-01 | $60,608.01 | $11,825.20 |
| 2012-06-01 | $56,833.21 | $12,312.43 |
| 2012-07-01 | $58,213.35 | $12,483.44 |
| 2012-08-01 | $58,770.50 | $12,764.61 |
| 2012-09-01 | $61,583.58 | $13,094.48 |
| 2012-10-01 | $64,499.34 | $12,852.69 |
| 2012-11-01 | $62,654.19 | $12,927.22 |
| 2012-12-01 | $62,430.23 | $13,045.05 |
| 2013-01-01 | $60,971.44 | $13,720.73 |
| 2013-02-01 | $60,558.13 | $13,906.99 |
| 2013-03-01 | $57,527.29 | $14,428.55 |
| 2013-04-01 | $58,124.86 | $14,706.54 |
| 2013-05-01 | $53,770.70 | $15,050.53 |
| 2013-06-01 | $50,486.04 | $14,848.42 |
| 2013-07-01 | $44,905.05 | $15,604.01 |
| 2013-08-01 | $48,158.75 | $15,152.10 |
| 2013-09-01 | $50,824.34 | $15,627.24 |
| 2013-10-01 | $48,320.80 | $16,345.58 |
| 2013-11-01 | $48,184.24 | $16,843.70 |
| 2013-12-01 | $45,591.48 | $17,270.14 |
| 2014-01-01 | $43,878.14 | $16,673.00 |
| 2014-02-01 | $45,271.02 | $17,435.72 |
| 2014-03-01 | $48,278.92 | $17,582.25 |
| 2014-04-01 | $46,744.02 | $17,712.21 |
| 2014-05-01 | $47,022.59 | $18,128.02 |
| 2014-06-01 | $45,544.14 | $18,502.48 |
| 2014-07-01 | $48,329.90 | $18,247.30 |
| 2014-08-01 | $46,687.57 | $18,977.26 |
| 2014-09-01 | $46,868.92 | $18,711.19 |
| 2014-10-01 | $44,016.52 | $19,168.21 |
| 2014-11-01 | $42,748.54 | $19,683.72 |
| 2014-12-01 | $42,498.00 | $19,634.14 |
| 2015-01-01 | $43,099.22 | $19,044.71 |
| 2015-02-01 | $46,713.43 | $20,139.28 |
| 2015-03-01 | $44,155.26 | $19,820.77 |
| 2015-04-01 | $43,082.83 | $20,010.94 |
| 2015-05-01 | $43,110.14 | $20,268.25 |
| 2015-06-01 | $43,324.99 | $19,875.88 |
| 2015-07-01 | $42,685.91 | $20,292.32 |
| 2015-08-01 | $39,889.22 | $19,068.00 |
| 2015-09-01 | $41,298.49 | $18,596.19 |
| 2015-10-01 | $40,588.39 | $20,164.86 |
| 2015-11-01 | $41,586.17 | $20,224.81 |
| 2015-12-01 | $38,746.51 | $19,905.83 |
| 2016-01-01 | $38,633.26 | $18,918.03 |
| 2016-02-01 | $40,699.09 | $18,892.51 |
| 2016-03-01 | $45,073.29 | $20,174.13 |
| 2016-04-01 | $44,861.71 | $20,252.36 |
| 2016-05-01 | $47,097.97 | $20,616.04 |
| 2016-06-01 | $44,233.19 | $20,669.48 |
| 2016-07-01 | $48,132.89 | $21,431.53 |
| 2016-08-01 | $49,182.01 | $21,461.63 |
| 2016-09-01 | $47,647.48 | $21,465.64 |
| 2016-10-01 | $47,915.13 | $21,074.10 |
| 2016-11-01 | $46,512.42 | $21,854.58 |
| 2016-12-01 | $42,704.11 | $22,286.54 |
| 2017-01-01 | $41,930.65 | $22,709.24 |
| 2017-02-01 | $44,080.97 | $23,610.98 |
| 2017-03-01 | $45,465.11 | $23,638.48 |
| 2017-04-01 | $45,469.12 | $23,881.26 |
| 2017-05-01 | $46,161.74 | $24,217.33 |
| 2017-06-01 | $46,177.76 | $24,368.49 |
| 2017-07-01 | $45,198.56 | $24,869.57 |
| 2017-08-01 | $46,212.72 | $24,945.72 |
| 2017-09-01 | $48,126.34 | $25,460.30 |
| 2017-10-01 | $46,578.69 | $26,054.41 |
| 2017-11-01 | $46,291.01 | $26,853.49 |
| 2017-12-01 | $46,406.08 | $27,152.05 |
| 2018-01-01 | $47,428.99 | $28,706.61 |
| 2018-02-01 | $48,967.53 | $27,648.61 |
| 2018-03-01 | $47,982.86 | $26,945.94 |
| 2018-04-01 | $48,213.73 | $27,049.34 |
| 2018-05-01 | $47,884.18 | $27,700.75 |
| 2018-06-01 | $47,264.03 | $27,871.23 |
| 2018-07-01 | $45,600.94 | $28,908.45 |
| 2018-08-01 | $44,550.73 | $29,850.40 |
| 2018-09-01 | $43,724.10 | $30,020.31 |
| 2018-10-01 | $43,395.64 | $27,968.42 |
| 2018-11-01 | $44,213.16 | $28,538.37 |
| 2018-12-01 | $44,495.01 | $25,961.64 |
| 2019-01-01 | $46,710.88 | $28,042.08 |
| 2019-02-01 | $48,088.47 | $28,942.46 |
| 2019-03-01 | $47,800.79 | $29,504.85 |
| 2019-04-01 | $47,044.81 | $30,699.49 |
| 2019-05-01 | $46,733.46 | $28,748.59 |
| 2019-06-01 | $47,530.95 | $30,774.70 |
| 2019-07-01 | $51,312.67 | $31,217.03 |
| 2019-08-01 | $51,474.72 | $30,722.51 |
| 2019-09-01 | $55,345.65 | $31,297.35 |
| 2019-10-01 | $53,603.19 | $31,975.22 |
| 2019-11-01 | $55,102.04 | $33,135.89 |
| 2019-12-01 | $53,308.22 | $34,136.02 |
| 2020-01-01 | $55,242.23 | $34,122.64 |
| 2020-02-01 | $57,893.26 | $31,313.70 |
| 2020-03-01 | $57,708.64 | $27,446.04 |
| 2020-04-01 | $57,210.11 | $30,964.46 |
| 2020-05-01 | $61,180.83 | $32,439.21 |
| 2020-06-01 | $62,863.57 | $33,084.37 |
| 2020-07-01 | $64,843.47 | $34,949.84 |
| 2020-08-01 | $71,908.75 | $37,462.03 |
| 2020-09-01 | $71,728.85 | $36,038.58 |
| 2020-10-01 | $68,658.69 | $35,080.22 |
| 2020-11-01 | $68,385.94 | $38,920.22 |
| 2020-12-01 | $64,710.55 | $40,416.65 |
| 2021-01-01 | $69,061.08 | $40,008.59 |
| 2021-02-01 | $67,225.75 | $41,111.81 |
| 2021-03-01 | $63,125.40 | $42,912.33 |
| 2021-04-01 | $62,161.12 | $45,202.52 |
| 2021-05-01 | $64,403.57 | $45,518.22 |
| 2021-06-01 | $69,420.49 | $46,580.86 |
| 2021-07-01 | $64,447.63 | $47,687.36 |
| 2021-08-01 | $66,041.89 | $49,137.32 |
| 2021-09-01 | $66,036.43 | $46,851.98 |
| 2021-10-01 | $63,969.14 | $50,134.49 |
| 2021-11-01 | $64,921.40 | $49,787.12 |
| 2021-12-01 | $64,592.57 | $52,018.40 |
| 2022-01-01 | $66,581.20 | $49,326.61 |
| 2022-02-01 | $65,418.83 | $47,849.66 |
| 2022-03-01 | $69,476.57 | $49,626.32 |
| 2022-04-01 | $70,544.63 | $45,298.83 |
| 2022-05-01 | $69,057.80 | $45,381.91 |
| 2022-06-01 | $66,898.01 | $41,635.92 |
| 2022-07-01 | $65,798.27 | $45,474.94 |
| 2022-08-01 | $64,280.85 | $43,620.41 |
| 2022-09-01 | $62,295.50 | $39,602.99 |
| 2022-10-01 | $60,437.23 | $42,809.30 |
| 2022-11-01 | $59,470.40 | $45,201.68 |
| 2022-12-01 | $64,398.47 | $42,597.40 |
| 2023-01-01 | $66,435.90 | $45,273.98 |
| 2023-02-01 | $70,204.15 | $44,169.31 |
| 2023-03-01 | $66,536.05 | $45,790.95 |
| 2023-04-01 | $71,661.49 | $46,505.70 |
| 2023-05-01 | $72,453.52 | $46,707.85 |
| 2023-06-01 | $71,457.56 | $49,794.10 |
| 2023-07-01 | $69,901.54 | $51,393.71 |
| 2023-08-01 | $71,526.39 | $50,575.46 |
| 2023-09-01 | $70,636.03 | $48,164.12 |
| 2023-10-01 | $67,306.59 | $47,151.38 |
| 2023-11-01 | $72,200.43 | $51,457.52 |
| 2023-12-01 | $74,132.26 | $53,795.26 |
| 2024-01-01 | $75,109.64 | $54,699.25 |
| 2024-02-01 | $74,184.70 | $57,619.96 |
| 2024-03-01 | $74,405.01 | $59,473.86 |
| 2024-04-01 | $81,292.58 | $57,044.65 |
| 2024-05-01 | $83,229.51 | $59,873.22 |
| 2024-06-01 | $84,737.10 | $62,021.57 |
| 2024-07-01 | $84,691.21 | $62,776.53 |
| 2024-08-01 | $89,148.07 | $64,299.26 |
| 2024-09-01 | $91,148.36 | $65,672.50 |
| 2024-10-01 | $95,935.50 | $65,076.99 |
| 2024-11-01 | $99,916.05 | $68,897.04 |
| 2024-12-01 | $99,646.21 | $67,254.67 |
| 2025-01-01 | $96,097.18 | $69,127.53 |
| 2025-02-01 | $96,761.03 | $68,225.58 |
| 2025-03-01 | $102,453.82 | $69,590.23 |
| 2025-04-01 | $105,375.05 | $63,944.86 |
| 2025-05-01 | $114,109.60 | $67,969.88 |
| 2025-06-01 | $118,017.32 | $71,426.32 |
| 2025-07-01 | $123,091.05 | $73,029.31 |
| 2025-08-01 | $122,258.96 | $74,509.75 |
| 2025-09-01 | $122,841.97 | $77,229.35 |
| 2025-10-01 | $126,596.38 | $77,495.83 |
Data as of October 1, 2025. S&P 500 total return includes dividends automatically reinvested.
The value difference in the gold investment as of October 1st, 2025 is $49,100.54, or 63.4% greater than the S&P 500 in percentage terms.
Why Gold Pulled Ahead of Stocks
Stocks endured deep drawdowns in 2001–02, 2008–09, and 2022, which slowed compounding even with dividends.
Meanwhile, gold benefited from rising inflation, currency volatility, and persistent buying from central banks and other public institutions.
Notably, gold reached record levels in 2024–2025 as macroeconomic risks remained elevated.
Gold Buying Returns and Methods
Across 25+ years, gold delivered higher terminal wealth and fewer severe setbacks. Consequently, it preserved purchasing power when shocks arrived and compounded when stability returned.
For long-horizon savers who value resilience and liquidity, the dataset underscores a simple point: since the dawn of the new millennium, gold won the “gold or stocks” question.
For investors seeking to buy into gold, there are several ways to own bullion. However, costs matter over decades. Even small annual fees compound and widen gaps between metals and ETFs.
Many investors therefore prefer vaulted, allocated gold for direct ownership and transparent storage—paired with BullionVault’s fast, online liquidity.
![]()
Buy Gold Online
Related Topics: #vaulted gold #Bullionvault #stocks #s&p 500 #gold #investing
Click for Comments
var disqus_shortname = "visualcapitalist.disqus.com";
var disqus_title = "Gold or Stocks? $10K After 25 Years";
var disqus_url = "https://www.visualcapitalist.com/sp/bv01-gold-or-stocks-10k-after-25-years/";
var disqus_identifier = "visualcapitalist.disqus.com-183931";
You may also like
-

Gold2 weeks ago
Charted: A Decade of Central Bank Gold Purchases
Central bank gold buying has reshaped the market over the past decade. This piece charts the trend and spotlights 2025’s leading buyers—and why it matters.
Subscribe
Please enable JavaScript in your browser to complete this form.Join 375,000+ email subscribers: *Sign Up