![]()
See more visualizations like this on the Voronoi app.
Use This Visualization
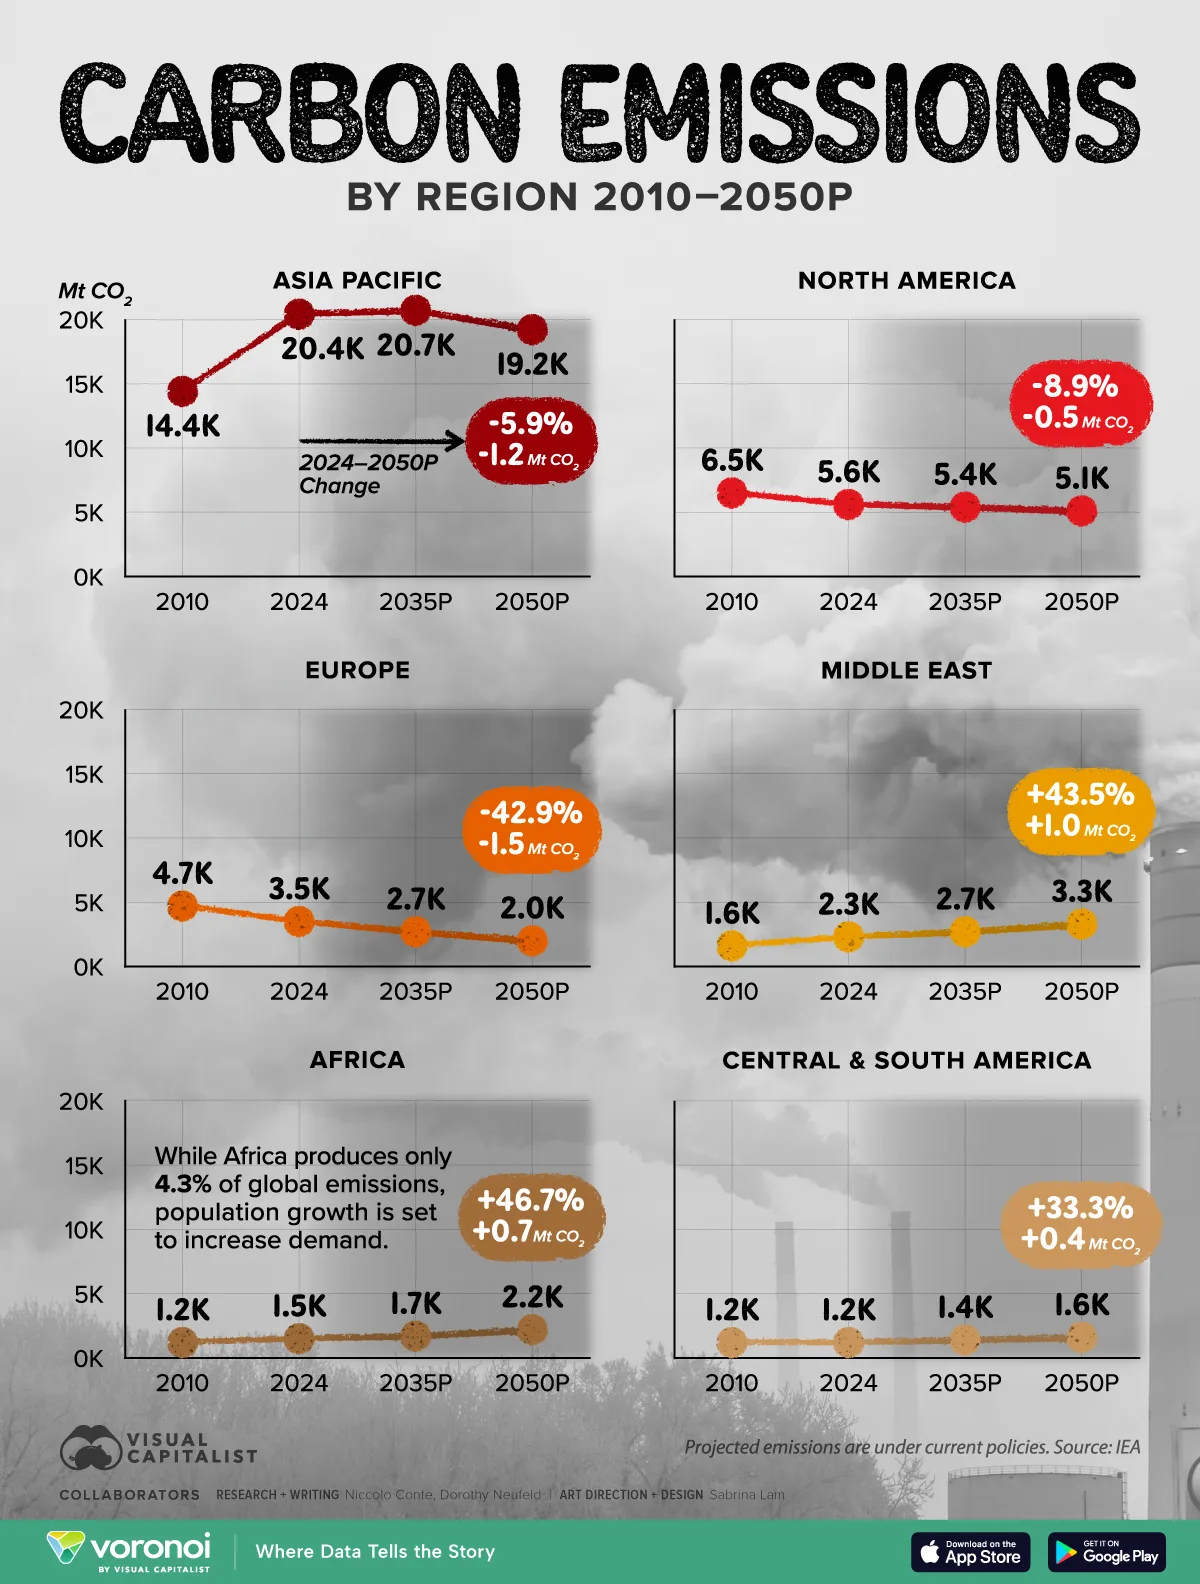
Carbon Emissions by Region 2010-2050P
See visuals like this from many other data creators on our Voronoi app. Download it for free on iOS or Android and discover incredible data-driven charts from a variety of trusted sources.
Key Takeaways
- Carbon emissions are forecast to decline across Europe, North America, and Asia-Pacific between 2024 and 2050.
- Africa and the Middle East are projected to see emissions rise significantly over the period, as population growth increases energy demand.
By 2050, Europe’s carbon emissions are projected to be 42.9% lower than 2024 levels.
Like Europe, Asia-Pacific, and North America are forecast to see emissions decrease over time as populations shrink and green technologies gain wider adoption.
This graphic shows carbon emission projections by region, based on data from the IEA.
The Global Outlook for Carbon Emissions
Below, we show the forecasted change in carbon emissions across global regions:
| Mt CO₂ (in thousands) | 2010 | 2024 | 2050P | Change2024-2050P |
|---|---|---|---|---|
| North America | 6.5 | 5.6 | 5.1 | -8.9% |
| Central & South America | 1.2 | 1.2 | 1.6 | 33.3% |
| Europe | 4.7 | 3.5 | 2.0 | -42.9% |
| Africa | 1.2 | 1.5 | 2.2 | 46.7% |
| Middle East | 1.6 | 2.3 | 3.3 | 43.5% |
| Asia Pacific | 14.4 | 20.4 | 19.2 | -5.9% |
In 2050, global emissions are set to reach 334,000 Mt, decreasing from 34,500 Mt in 2024.
Despite the Asia-Pacific region contributing the highest share of emissions, they are projected to fall by nearly 6% over the next 25 years. China, in particular, has rapidly expanded its EV market, along with driving the lion’s share of global clean energy additions in recent years.
In North America, carbon emissions are set to decrease nearly 9%. Still, this is far from meeting climate goals. Notably, 92% of new U.S. electricity additions in 2025 and 2026 are from clean sources.
In contrast, Africa and the Middle East are projected to see a substantial rise in emissions. With some of the world’s fastest-growing populations, rising energy demand is set to increase emissions by over 40%. However, each region comprises a relatively small share of the global total by 2050.
Learn More on the Voronoi App ![]()
To learn more about this topic, check out this graphic on global carbon emissions by sector.