 12 NASA Satellite Images That Tell the Story of Earth in 2025
From devastating wildfires to swirling cloud vortices, NASA’s fleet of Earth-observing satellites captured remarkable views of our planet throughout 2025. These images reveal both the beauty and fragility of Earth’s systems, documenting natural phenomena, climate events, and human impacts visible from space.
All images featured in this article come from NASA’s Earth Observatory, captured by instruments aboard a variety of satellites in orbit around Earth. Together, they tell the story of a dynamic planet in constant flux.
The Palisades Fire’s Footprint
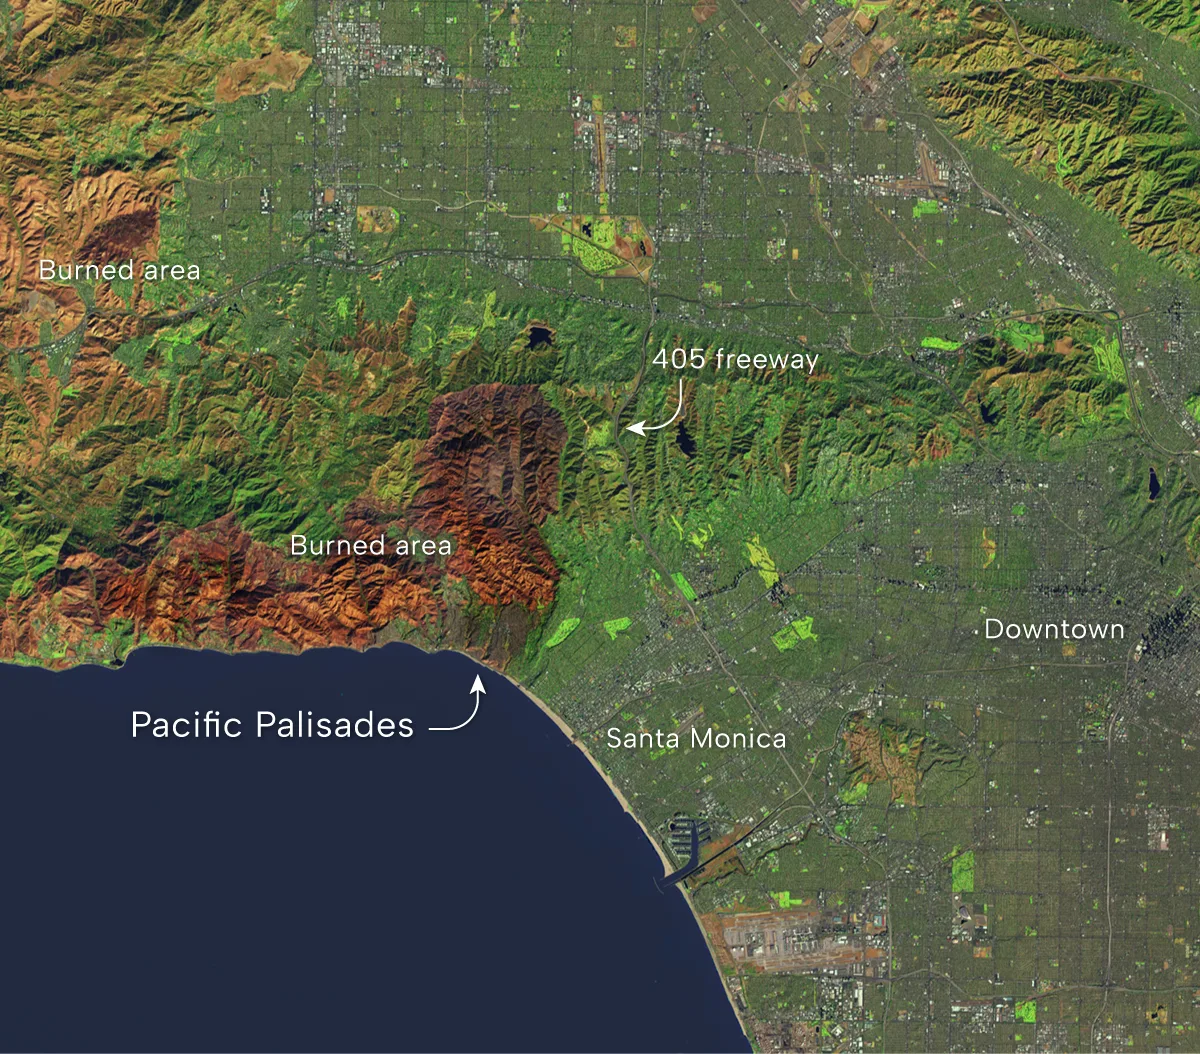
NASA Earth Observatory/Lauren Dauphin, using Landsat data from the U.S. Geological Survey
This false-color Landsat 9 image from January 14, 2025, reveals the burn scar left by the Palisades fire in Los Angeles County.
The fire ignited on the morning of January 7 near the Pacific Palisades neighborhood and spread rapidly, consuming nearly 24,000 acres (97 square kilometers) of wildland and developed areas within one week. In this image, which combines shortwave infrared, near infrared, and visible light, unburned vegetation appears green while recently burned landscape shows as light to dark brown.
The charred areas stretch north and west of Pacific Palisades toward Malibu, where land previously burned by the December 2024 Franklin fire is also visible along the coast.
Desert Dust Streams from Iran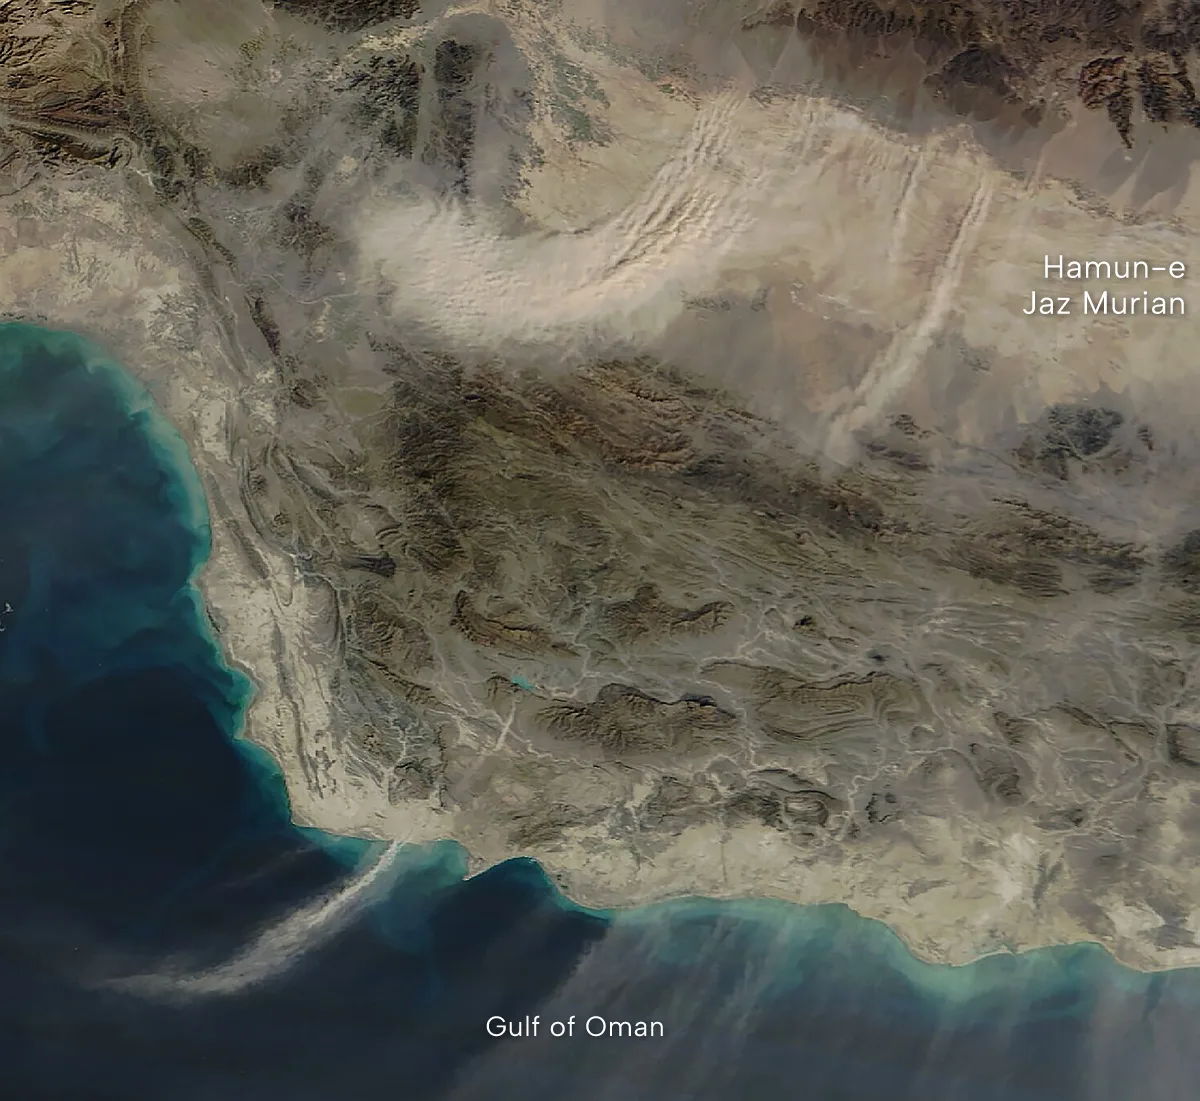
NASA Earth Observatory/Michala Garrison, using MODIS data from NASA EOSDIS LANCE and GIBS/Worldview
This Terra MODIS image from January 22, 2025, captures dust plumes sweeping across southeastern Iran and streaming over the Gulf of Oman toward the Arabian Peninsula.
The airborne material originates primarily from the dried bed of Hamun-e Jazmurian, an intermittent lake in one of southwest Asia’s major dust source regions. In this arid basin, some areas receive less than 10 centimeters (4 inches) of annual rainfall while evaporation rates remain high.
The dust traveled south-southwest across the water to the coast of the United Arab Emirates, where the haze reduced visibility and prompted weather warnings. Beyond disrupting transportation, such dust events pose health risks: a recent analysis found that material from Jazmurian basin storms contains heavy metals and other substances hazardous to human and ecosystem health.
Floating Solar Farm on India’s Narmada River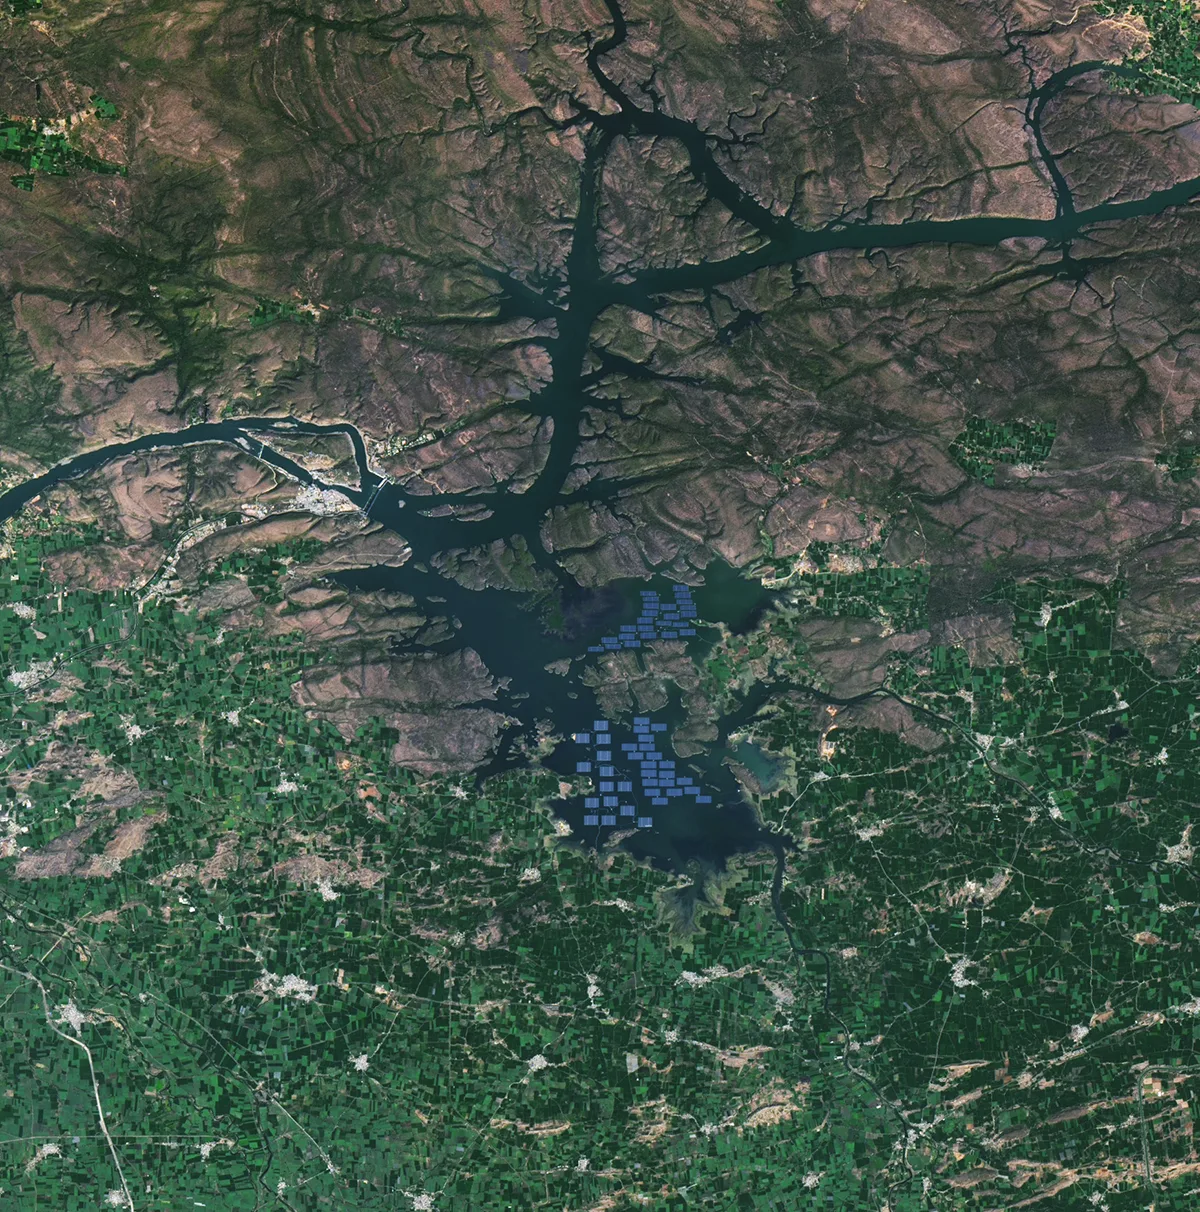
NASA Earth Observatory/Lauren Dauphin, using Landsat data from the U.S. Geological Survey
This Landsat 9 image from January 30, 2025, shows arrays of floating solar panels, known as “floatovoltaics,” spread across a reservoir on the Narmada River in Madhya Pradesh, India.
The geometric blue rectangles visible in the reservoir represent two floating solar projects commissioned in 2024, with a combined capacity of 216 megawatts. The reservoir, created by the Omkareshwar Dam completed in 2007, spans more than 90 square kilometers.
Floating solar installations offer an alternative to land-based systems in areas where space is limited. They can also reduce evaporation, impede algal growth, and benefit from the cooling effect of water on panel efficiency.
Swirling Skies and Melting Icebergs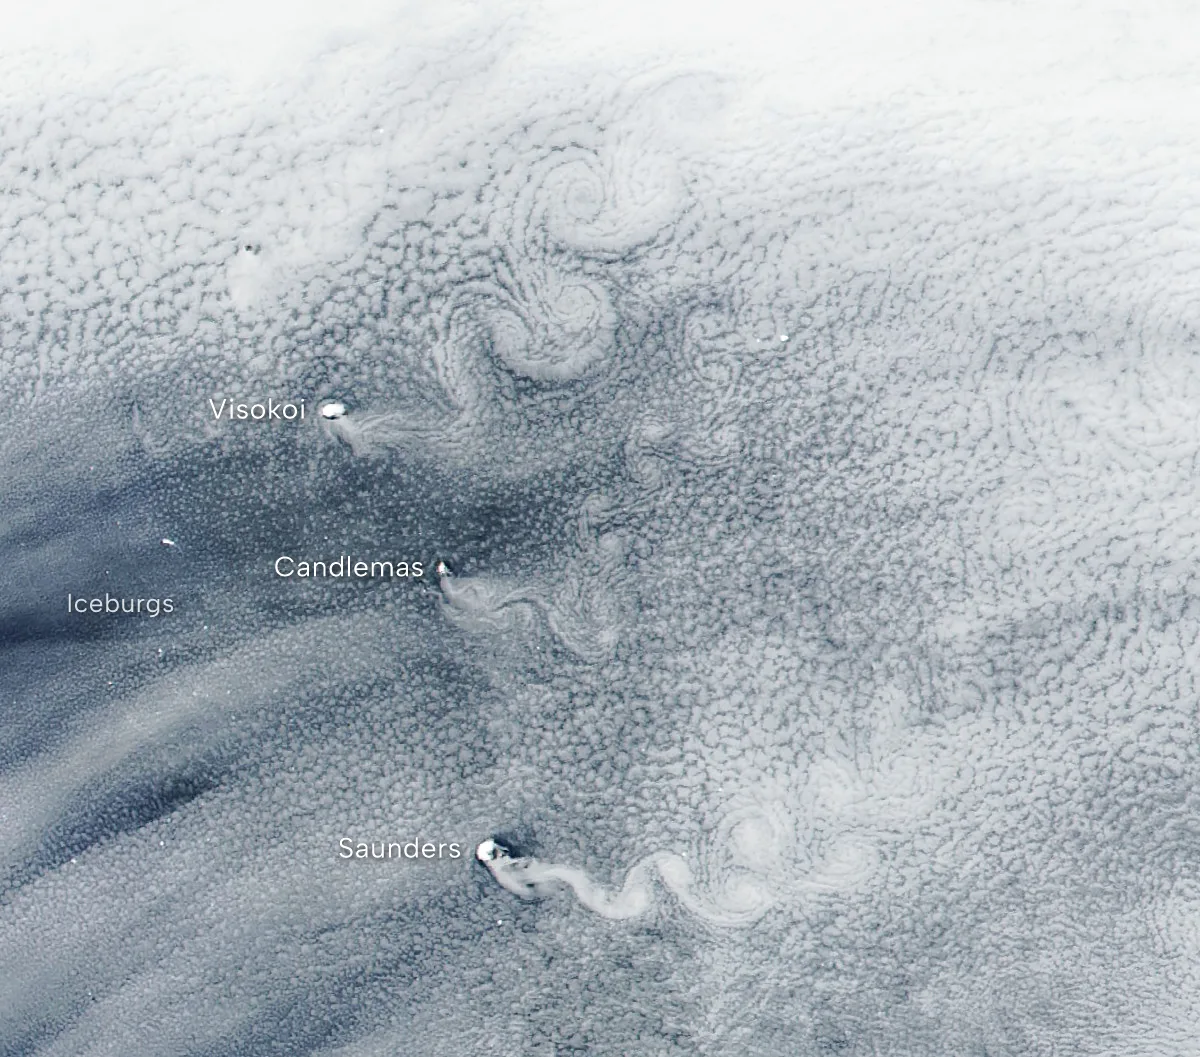
NASA Earth Observatory/Wanmei Liang, using VIIRS data from NASA EOSDIS LANCE, GIBS/Worldview, and the Joint Polar Satellite System (JPSS)
This NOAA-20 VIIRS image from February 24, 2025, captures von Kármán vortex streets forming behind three of the remote South Sandwich Islands in the southern Atlantic Ocean. The swirling cloud patterns appear when persistent westerly winds of moderate strength push marine stratocumulus clouds past the steep volcanic peaks of Visokoi, Candlemas, and Saunders islands.
Named after mathematician and aerospace engineer Theodore von Kármán, who first described these oscillating flow features in 1911, the vortices form alternating spirals that rotate in opposite directions downstream of each obstacle. The cloud trail extending from Saunders Island appears slightly brighter than surrounding clouds due to volcanic emissions from Mount Michael, which has been weakly erupting since 2014. To the west of the island chain, several icebergs drift visibly beneath thin cloud cover.
Haze Sweeps Over the Mediterranean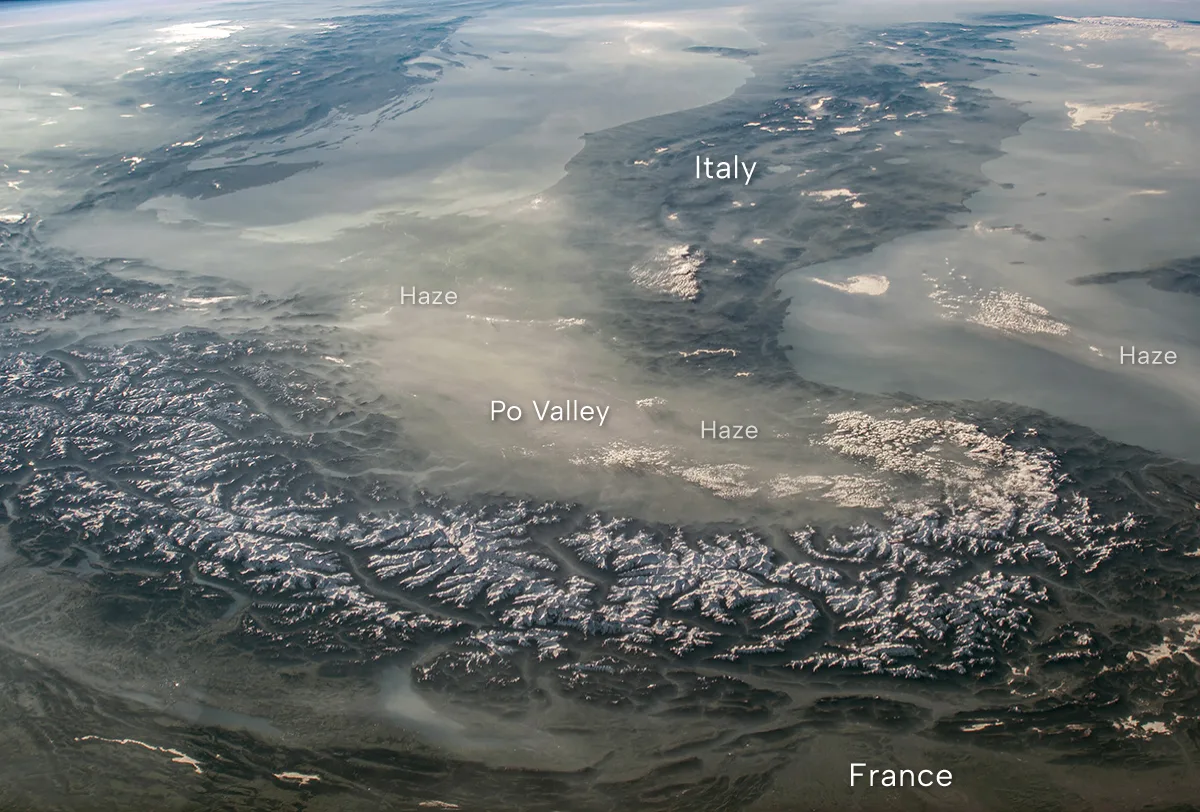
NASA/ISS External Camera
This photograph from the International Space Station’s external camera on April 30, 2025, provides an oblique view stretching from the Alps to Sicily, revealing layers of industrial haze drifting across the Mediterranean basin.
Much of the haze originates from the Po Valley in northern Italy and the Rhône Valley in France, where surrounding mountains trap pollutants. The Po Valley haze drifts hundreds of kilometers over the Adriatic Sea toward Greece. Astronauts have documented this atmospheric phenomenon for decades, providing a unique perspective on how geography shapes air quality across southern Europe.
Glacier Collapse Buries Swiss Village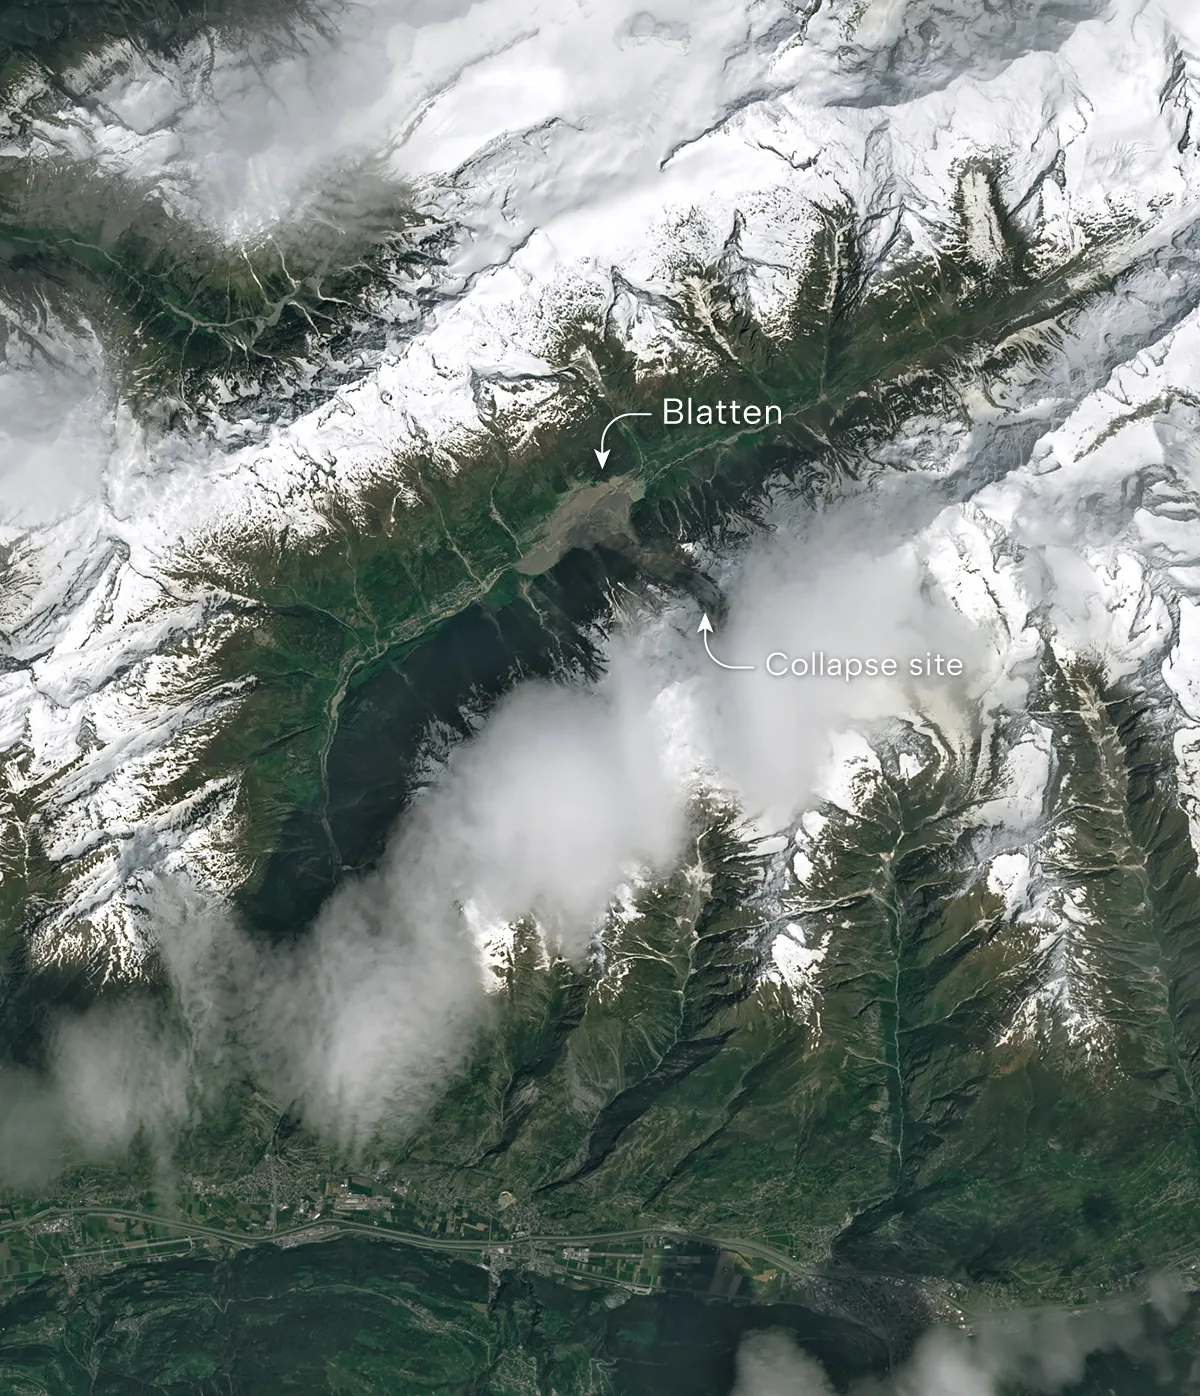
NASA Earth Observatory/Wanmei Liang, using Landsat data from the U.S. Geological Survey
This Landsat 9 image from May 29, 2025, shows the aftermath of a catastrophic collapse of the Birch Glacier in Switzerland’s Lötschental valley.
The debris buried most of the village of Blatten, traveled 2.5 kilometers down the valley, and climbed 240 meters up the opposite valley wall before damming the Lonza River and causing flooding. Authorities began evacuating residents on May 19 after detecting instability. By May 27, the glacier was moving at 10 meters per day. Scientists believe rockfall accumulation on top of the glacier led to basal melting that reduced friction, triggering the collapse. The event was unusual in magnitude for the Swiss Alps.
Rare Snow Blankets Australia’s Northern Tablelands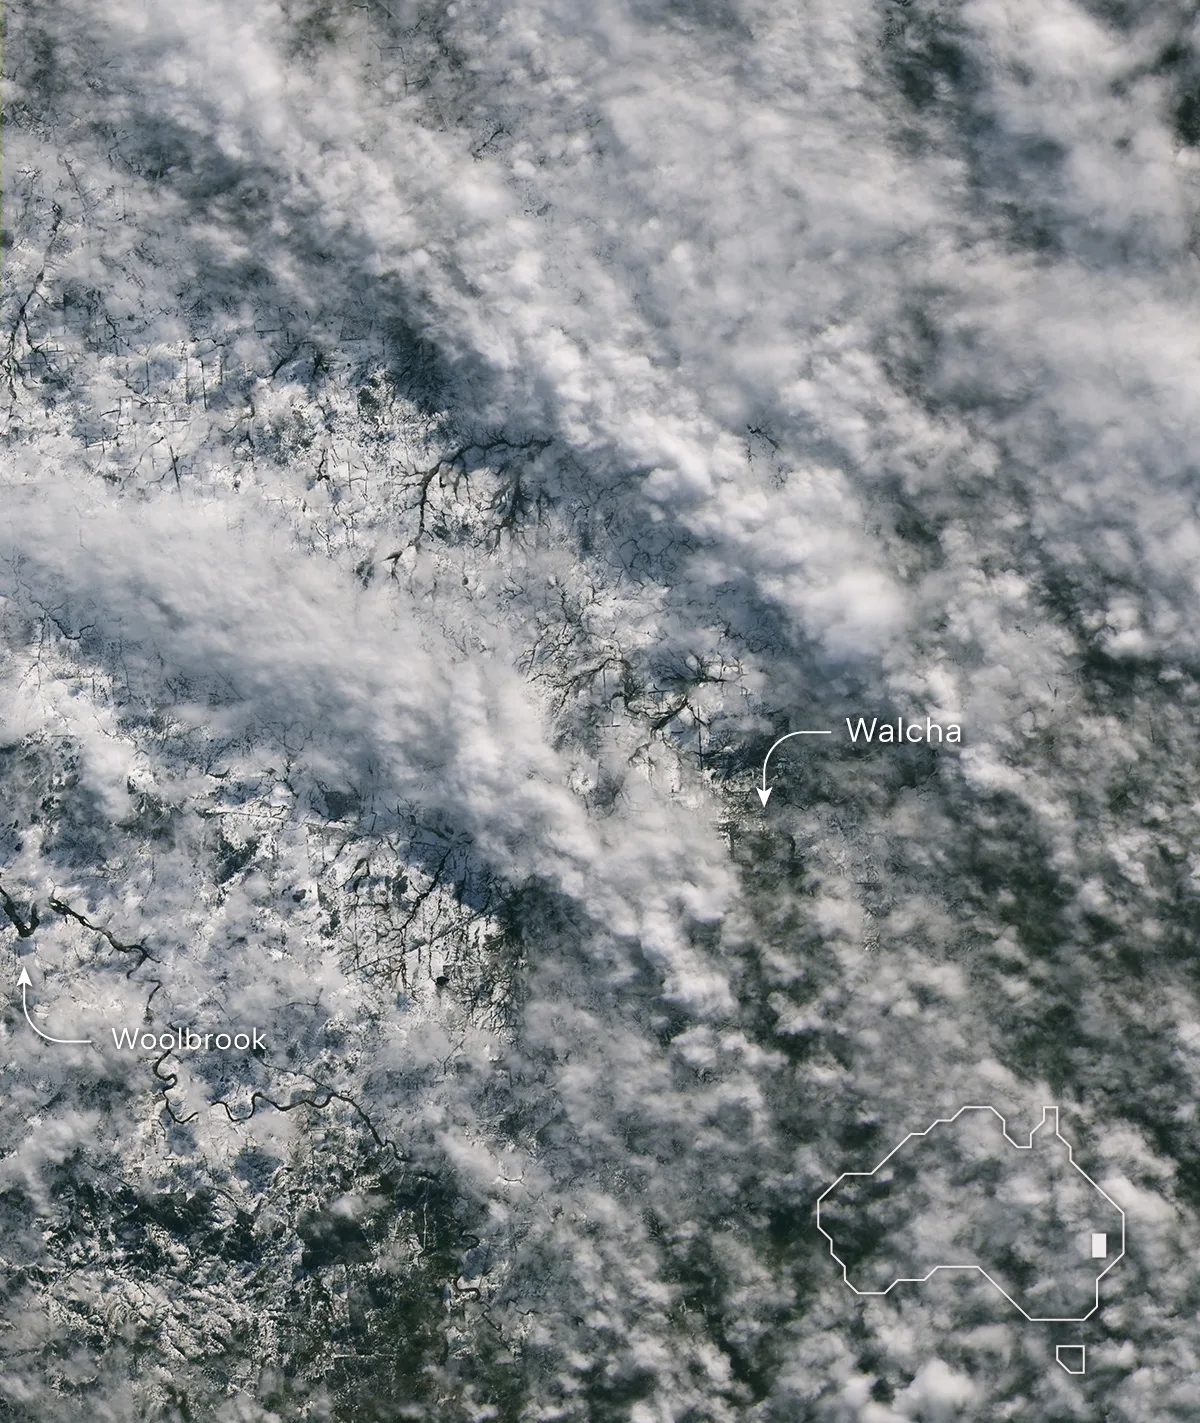
NASA Earth Observatory/Wanmei Liang, using Landsat data from the U.S. Geological Survey
This Landsat 8 image from August 3, 2025, captures a rare blanket of snow across New South Wales’ Northern Tablelands, the heaviest snowfall in the region since the mid-1980s.
A powerful low-pressure system brought up to 40 centimeters (16 inches) of snow to the highlands while dumping more than 100 millimeters of rain at lower elevations. The storm stranded vehicles, closed highways, and left properties without power. Flooding triggered dozens of rescues across the region.
Phytoplankton Bloom in the Barents Sea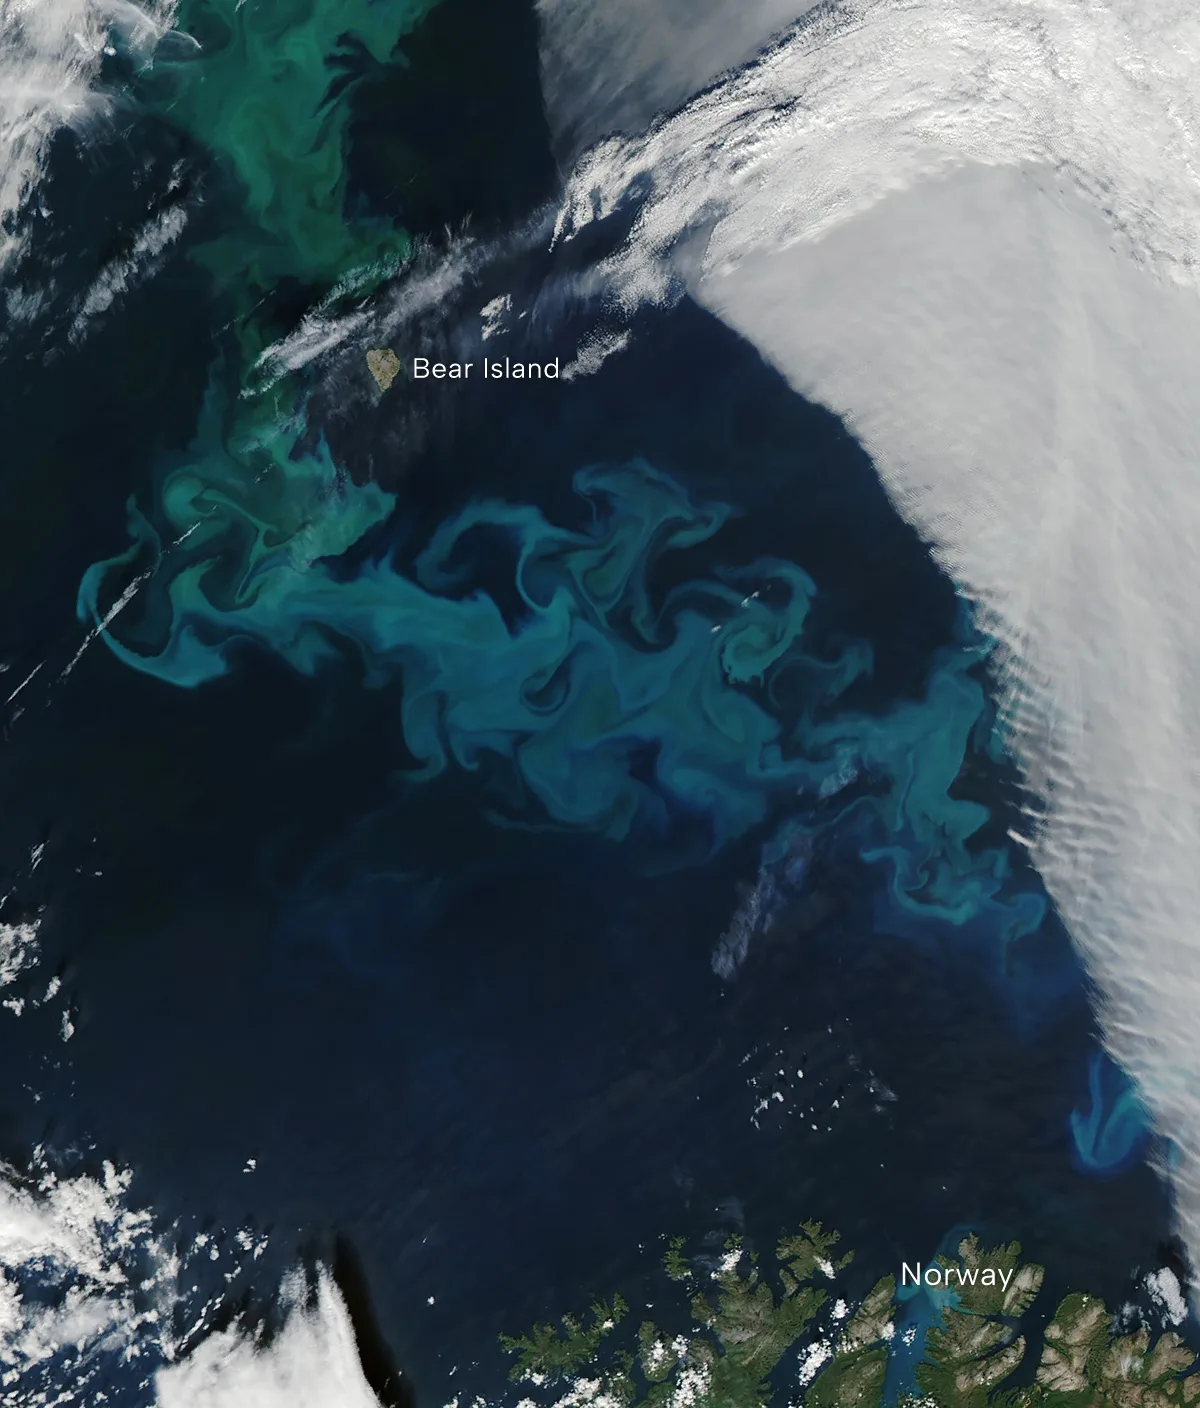
NASA Earth Observatory/Wanmei Liang, using MODIS data from NASA EOSDIS LANCE and GIBS/Worldview
This Aqua MODIS image from August 5, 2025, reveals a massive phytoplankton bloom swirling through the Barents Sea near Norway’s Bear Island.
The milky turquoise-blue colors indicate the presence of coccolithophores, single-celled organisms armored with calcium carbonate plates that scatter light. The green hues come from diatoms, another type of phytoplankton. The Barents Sea typically experiences two bloom seasons: diatoms dominate in May and June, while coccolithophores peak in August.
These microscopic organisms form the base of the Arctic marine food web and play a critical role in the ocean’s carbon cycle and oxygen production. Researchers are closely studying how warming Atlantic currents may be shifting the location and extent of these blooms.
Hurricane Erin Roils in the Atlantic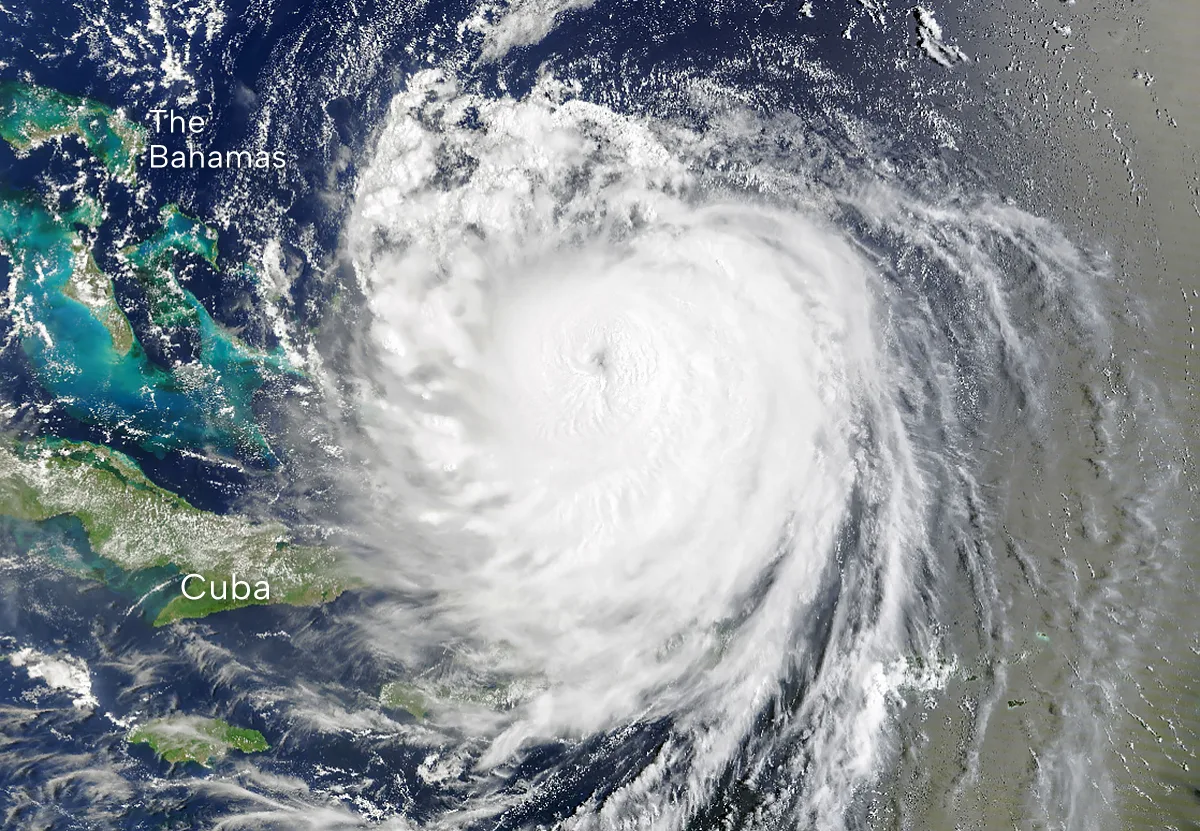
NASA Earth Observatory/Wanmei Liang, using MODIS data from NASA EOSDIS LANCE and GIBS/Worldview
This Terra MODIS image from August 18, 2025, shows Hurricane Erin churning in the Atlantic Ocean as the first hurricane of the 2025 season.
The storm underwent rapid intensification, jumping from Category 1 to Category 5 in just 24 hours between August 15 and 16, reaching peak sustained winds of 160 mph. Erin became only the 43rd Atlantic hurricane to reach Category 5 status since 1851, and the earliest to do so at this location.
Factors contributing to its explosive strengthening included light wind shear, a compact structure, and warm sea surface temperatures. While Erin did not make landfall, it caused more than 147,000 power outages in Puerto Rico and prompted evacuation orders for North Carolina’s Outer Banks.
British Columbia Wildfires Send Smoke Skyward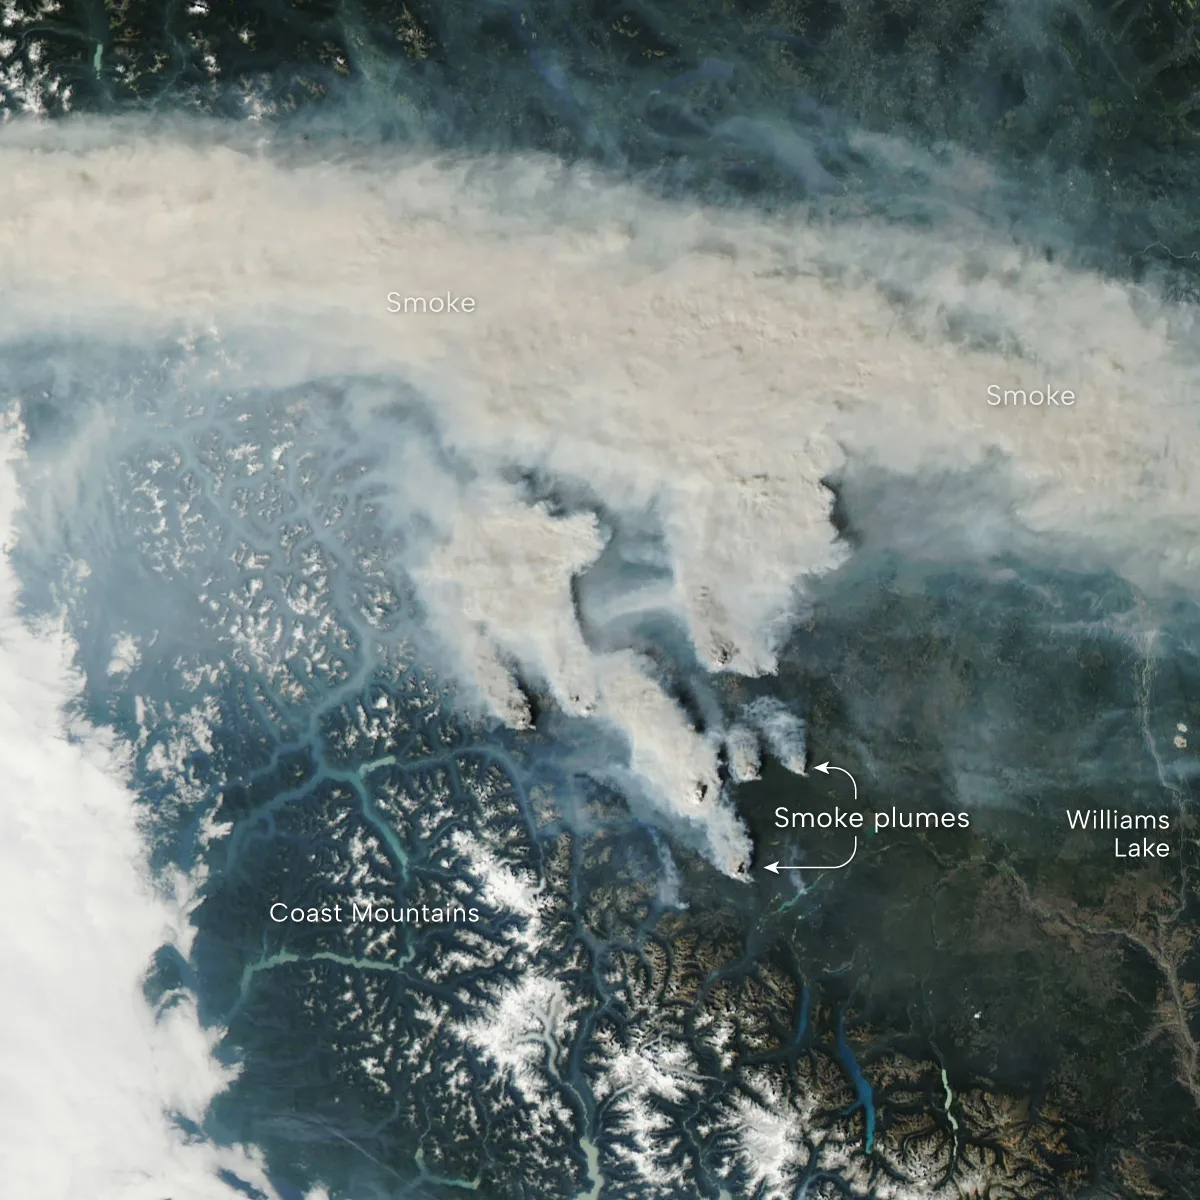
NASA Earth Observatory/Michala Garrison, using MODIS data from NASA EOSDIS LANCE and GIBS/Worldview
This Aqua MODIS image from September 2, 2025, captures thick smoke plumes rising from multiple lightning-ignited wildfires in British Columbia’s Cariboo region. The Itcha Lake fire had burned approximately 17,000 hectares (170 km²), while the Beef Trail Creek fire consumed around 7,800 hectares (78 km²) and the Dusty Lake fire charred about 2,800 hectares (28 km²). Evacuation orders were issued for surrounding communities.
The towering pyrocumulus clouds generated by these fires can inject smoke and particulate matter high into the atmosphere, where it can travel thousands of kilometers and degrade air quality across distant regions. By the end of the season, British Columbia had burned 732,000 hectares (7,320 km²), slightly above the 10-year average. Overall, Canada experienced one of its worst fire seasons on record, trailing only 2023.
A Desert Intersection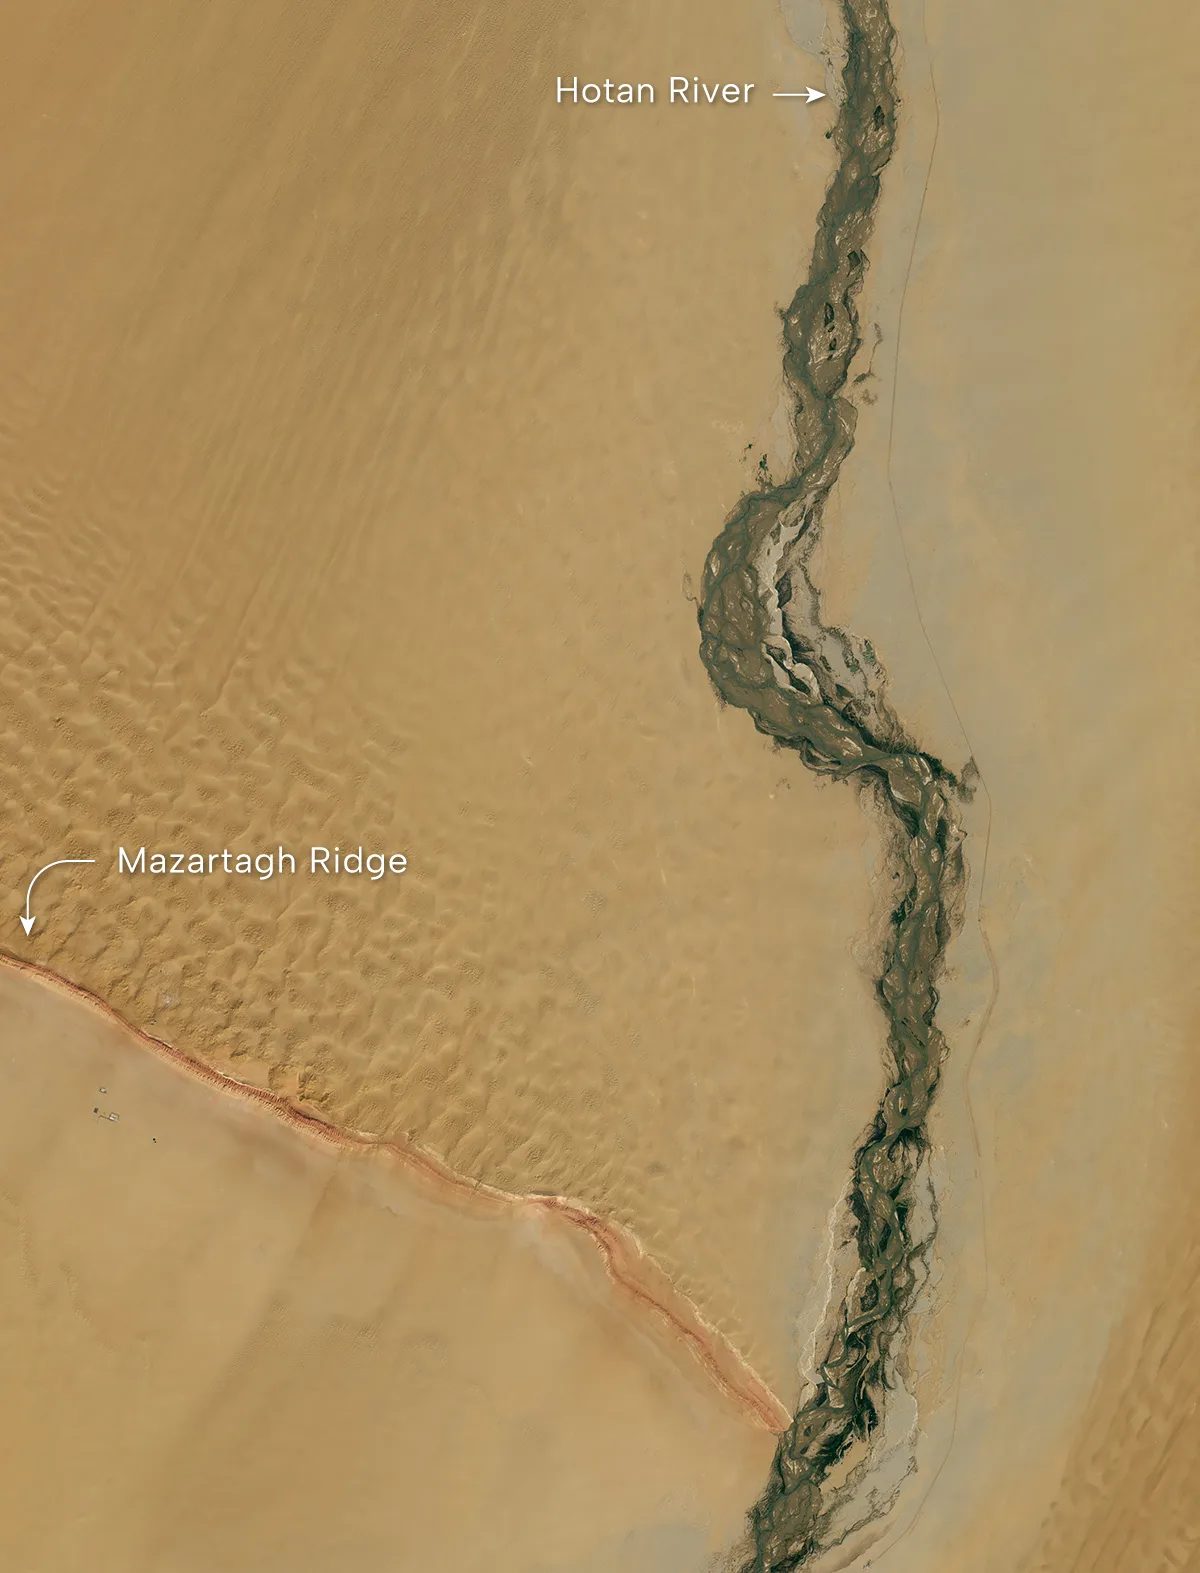
NASA Earth Observatory/Michala Garrison, using Landsat data from the U.S. Geological Survey
This Landsat 9 image from September 11, 2025, reveals a striking geological boundary in China’s Tarim Basin where the Mazartagh ridge meets the Hotan River. The 145 km (90 mile) ridge acts as a natural barrier, creating distinct dune patterns on either side.
The Hotan is the only river fed by glacial meltwater that maintains enough flow to cross the entire Takla Makan Desert. For centuries, this region served as an important source of nephrite jade collected along the ancient Silk Road.
Stubble Burning Shrouds Northern India in Haze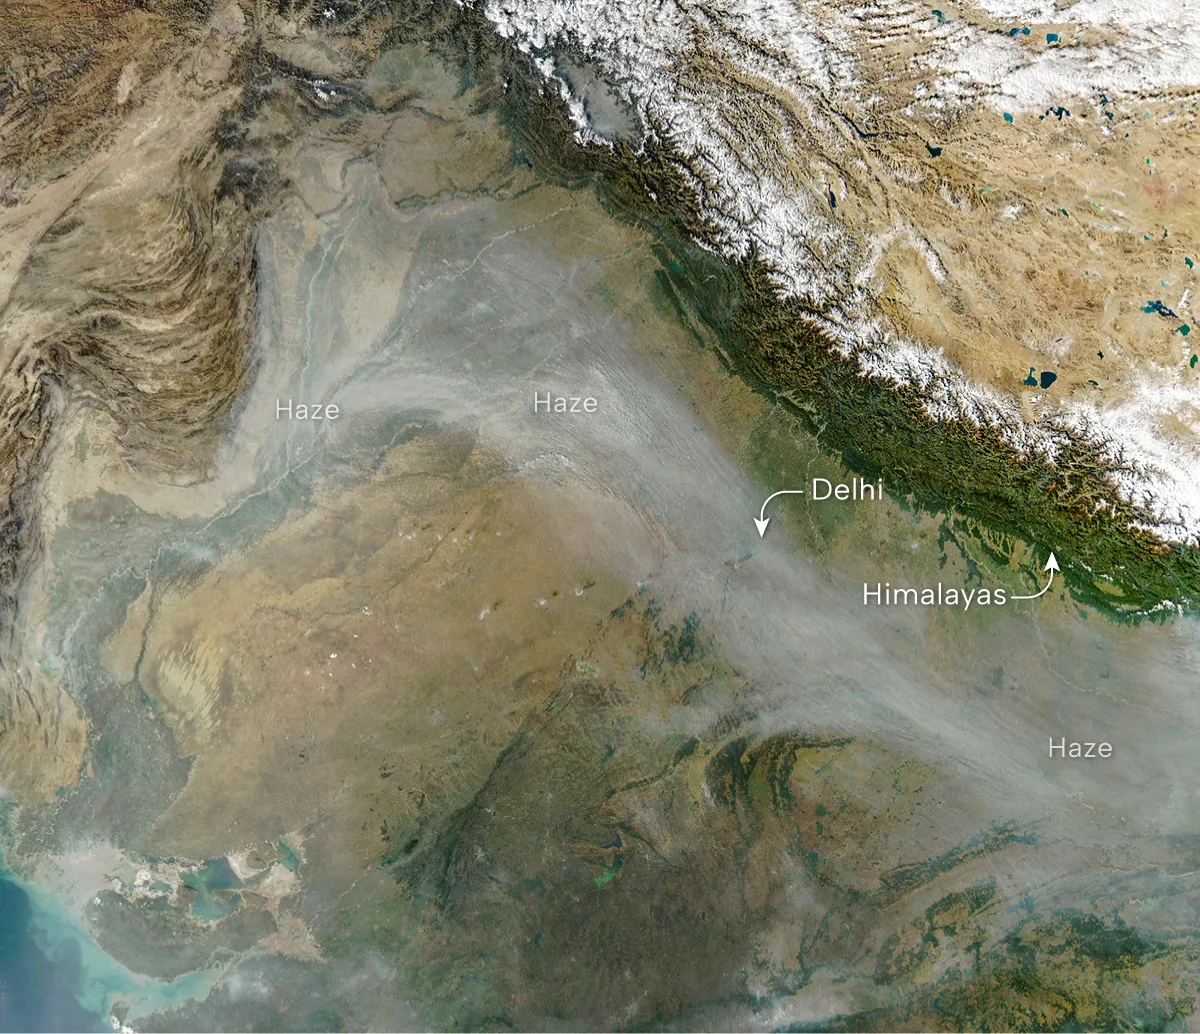
NASA Earth Observatory/Michala Garrison, using MODIS data from NASA EOSDIS LANCE and GIBS/Worldview
This Aqua MODIS image from November 11, 2025, shows thick haze blanketing northern India during the annual crop residue burning season.
Farmers in Punjab, Haryana, and Uttar Pradesh burn rice stubble between October and December to quickly clear fields before planting wheat.
On this day, air quality exceeded 400 on India’s national index, well into the “severe” category. Scientists have detected a shift in burning patterns: fires now peak from 4-6pm rather than the previous window of 1-2pm, meaning traditional satellite monitoring systems miss many fires. Estimates suggest stubble burning contributes 40-70% of particulate pollution on peak days.
The Tip of the Iceberg
These 12 images represent just a fraction of the thousands of observations NASA’s satellites make each year.
From tracking climate patterns to monitoring natural disasters, this orbital perspective helps scientists understand Earth’s interconnected systems and provides critical data for decision-makers around the world. As our planet continues to change, these eyes in the sky remain essential tools for documenting and responding to the challenges ahead.