![]()
See more visuals like this on the Voronoi app.
Use This Visualization
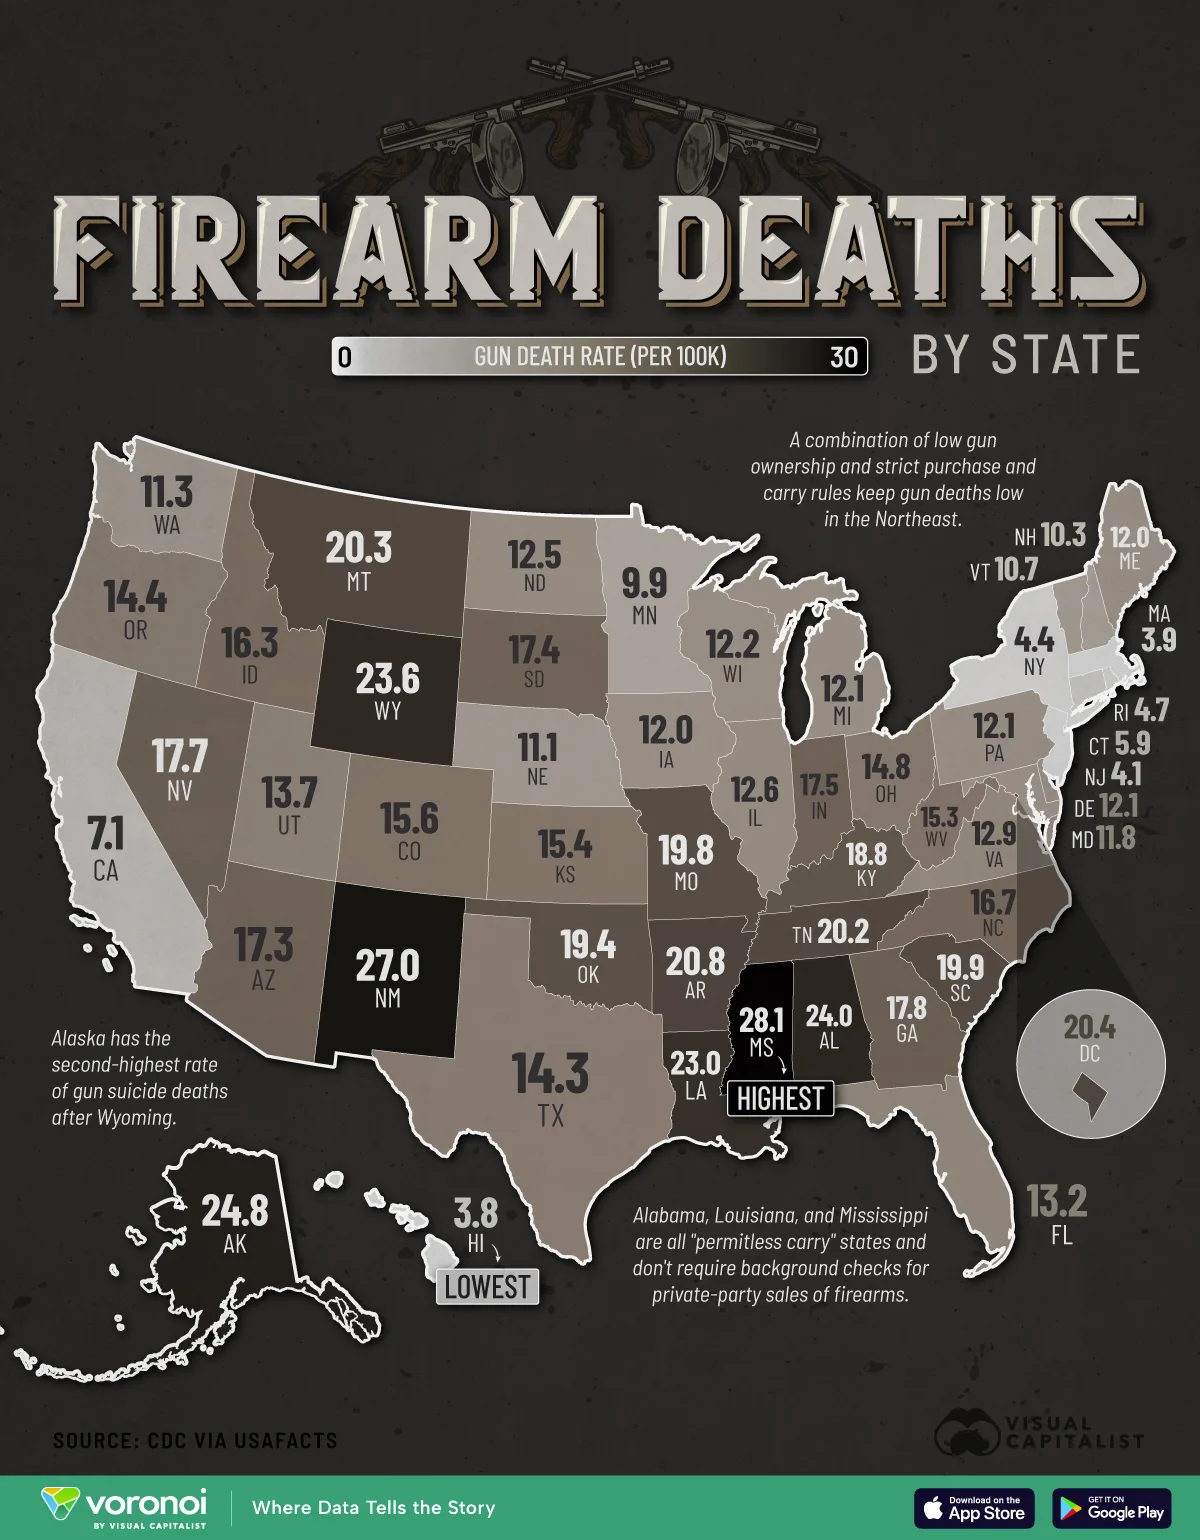
Mapped: Firearm Deaths by State
See visuals like this from many other data creators on our Voronoi app. Download it for free on iOS or Android and discover incredible data-driven charts from a variety of trusted sources.
Key Takeaways
- Gun death rates vary widely across the U.S., with the highest-rate states recording more than seven times the lowest.
- Southern and Mountain West states tend to have higher firearm death rates than the Northeast and West Coast.
Firearm-related deaths remain a major public health issue in the United States, but their prevalence differs sharply from state to state. Factors such as gun ownership rates, demographics, urbanization, and access to healthcare all play a role in shaping these outcomes.
This map highlights firearm death rates per 100,000 people. The data for this visualization comes from the CDC via USAFacts. Firearm deaths include homicides, suicides, and accidental shootings
Lowest Rates Concentrated in the Northeast and Hawaii
Hawaii reports the lowest firearm death rate in the country at 3.8 per 100,000 people. Several Northeastern states, including Massachusetts, New Jersey, New York, and Rhode Island, also fall near the bottom of the ranking.
| Rank (Low to High) | State | Gun Death Rate (per 100K) |
|---|---|---|
| 1 | Hawaii | 3.8 |
| 2 | Massachusetts | 3.9 |
| 3 | New Jersey | 4.1 |
| 4 | New York | 4.4 |
| 5 | Rhode Island | 4.7 |
| 6 | Connecticut | 5.9 |
| 7 | California | 7.1 |
| 8 | Minnesota | 9.9 |
| 9 | New Hampshire | 10.3 |
| 10 | Vermont | 10.7 |
| 11 | Nebraska | 11.1 |
| 12 | Washington state | 11.3 |
| 13 | Maryland | 11.8 |
| 14 | Iowa | 12.0 |
| 15 | Maine | 12.0 |
| 16 | Delaware | 12.1 |
| 17 | Michigan | 12.1 |
| 18 | Pennsylvania | 12.1 |
| 19 | Wisconsin | 12.2 |
| 20 | North Dakota | 12.5 |
| 21 | Illinois | 12.6 |
| 22 | Virginia | 12.9 |
| 23 | Florida | 13.2 |
| 24 | Utah | 13.7 |
| 25 | Texas | 14.3 |
| 26 | Oregon | 14.4 |
| 27 | Ohio | 14.8 |
| 28 | West Virginia | 15.3 |
| 29 | Kansas | 15.4 |
| 30 | Colorado | 15.6 |
| 31 | Idaho | 16.3 |
| 32 | North Carolina | 16.7 |
| 33 | Arizona | 17.3 |
| 34 | South Dakota | 17.4 |
| 35 | Indiana | 17.5 |
| 36 | Nevada | 17.7 |
| 37 | Georgia | 17.8 |
| 38 | Kentucky | 18.8 |
| 39 | Oklahoma | 19.4 |
| 40 | Missouri | 19.8 |
| 41 | South Carolina | 19.9 |
| 42 | Tennessee | 20.2 |
| 43 | Montana | 20.3 |
| 44 | Washington, DC | 20.4 |
| 45 | Arkansas | 20.8 |
| 46 | Louisiana | 23.0 |
| 47 | Wyoming | 23.6 |
| 48 | Alabama | 24.0 |
| 49 | Alaska | 24.8 |
| 50 | New Mexico | 27.0 |
| 51 | Mississippi | 28.1 |
These states tend to have lower gun ownership rates and denser urban populations, factors often associated with fewer firearm-related deaths overall.
Higher Rates Across the South and Mountain West
At the other end of the spectrum, Mississippi has the highest firearm death rate at 28.1 per 100,000 people. Alabama, Louisiana, New Mexico, Alaska, and Wyoming also rank near the top.
Many of these states have higher rates of gun ownership and larger rural populations, where firearm-related suicides account for a significant share of deaths.
Washington, D.C. Stands Out
Washington, D.C. records a firearm death rate of 20.4 per 100,000—higher than most states. As a dense urban area, its rate reflects different dynamics than rural states, including concentrated violent crime rather than firearm suicides.
Learn More on the Voronoi App ![]()
If you enjoyed today’s post, check out Mapped: The Highest Homicide Rates in the U.S. on Voronoi, the new app from Visual Capitalist.