
Published
1 hour ago
on
June 12, 2026
| 15 views
-->
By
Julia Wendling
Graphics & Design
- Abha Patil
The following content is sponsored by PICTON Investments
What Happens to $10M in Investment Gains After Taxes?
Taxes can quietly erode long-term investment returns. Two Canadians investing the same $1 million can earn identical 8% annualized returns over 30 years. Yet their final wealth can look dramatically different after taxes.
This visual, created in partnership with PICTON Investments, shows how investment income types shape long-term net returns. It highlights why tax-aware portfolio construction matters for Canadian investors focused on preserving wealth.
Why Tax Efficiency Matters
Different investment income faces different tax treatment in Canada. Interest income, rental income, and foreign income typically face the highest tax rates. Capital gains and eligible dividends often receive more favourable treatment. Over 30 years, the impact compounds significantly.
A portfolio generating interest income grows to just $3.2 million after taxes over 30 years, assuming 8% annualized returns. The same gross return generated through deferred capital gains grows to more than $7.5 million after taxes.
| Income Type | Gross End Value (No Tax) |
Net End Value (After Tax) |
Total Tax Paid (30 Years) |
|---|---|---|---|
| Interest/Foreign/Rental | $10,062,657 | $3,191,411 | $6,871,246 |
| Eligible Dividend | $10,062,657 | $4,498,204 | $5,564,453 |
| Realized Capital Gains | $10,062,657 | $5,698,151 | $4,364,506 |
| Deferred CG (Liquidated) | $10,062,657 | $7,511,773 | $2,550,884 |
| Non-Taxed | $10,062,657 | $10,062,657 | $0 |
For illustration purposes only.
That difference can reshape retirement outcomes, estate planning, and long-term wealth accumulation.
Net Investing Starts With Portfolio Design
Tax-efficient investing is not about chasing higher returns. It focuses on keeping more of what investors already earn.
PICTON calls this approach “net investing.” Advisors evaluate every decision through a net lens. That includes account location, investment structure, and income type.
The goal is simple: maximize net returns after taxes. Over time, disciplined tax management can create transformational differences in net wealth.
Tax Rates Vary Across Canada
Tax treatment also varies depending on where investors live.
Across Canadian provinces and territories, interest income tax rates range from 44.5% in Nunavut to 54.8% in Newfoundland and Labrador. Capital gains generally face lower effective tax rates, ranging from 22.3% to 27.4%.
| Tax Rate | ||||
|---|---|---|---|---|
| Province | Interest Income | Capital Gains* | Non-Eligible Div. | Eligible Div. |
| Newfoundland & Labrador | 54.8% | 27.4% | 49.0% | 54.8% |
| Nova Scotia | 54.0% | 27.0% | 50.0% | 54.0% |
| Ontario | 53.5% | 26.8% | 47.7% | 53.5% |
| Quebec | 53.3% | 26.7% | 48.7% | 53.3% |
| New Brunswick | 52.5% | 26.3% | 46.8% | 52.5% |
| Prince Edward Island | 52.0% | 26.0% | 47.9% | 52.0% |
| British Columbia | 53.5% | 26.8% | 48.9% | 53.5% |
| Alberta | 48.0% | 24.0% | 42.3% | 48.0% |
| Saskatchewan | 47.5% | 23.8% | 41.3% | 47.5% |
| Manitoba | 50.4% | 25.2% | 46.7% | 50.4% |
| Yukon | 48.0% | 24.0% | 44.0% | 48.0% |
| Northwest Territories | 47.1% | 23.5% | 36.8% | 47.1% |
| Nunavut | 44.50% | 22.30% | 37.80% | 44.50% |
* Effective tax rate on capital gain has accounted for the 50% inclusion for taxable income. As of May 11th, 2026.
Eligible Canadian dividends also benefit from preferential tax treatment in many provinces.
The Power of Net Returns
Taxes play a major role in long-term investing outcomes. Gross returns only tell part of the story. What investors keep after taxes ultimately determines how wealth compounds over time.
By incorporating tax considerations into portfolio construction, investors can improve net returns and build stronger long-term outcomes. From income type to account structure, every decision can influence after-tax wealth accumulation.
For Canadians focused on preserving and growing wealth, tax-efficient investing remains a critical part of building better portfolios.
![]()
Explore Portfolio Design with Taxes in Mind.
Source: Picton Mahoney Asset Management. For illustrative purposes only. Based on tax rates for an Ontario resident in the highest marginal tax bracket in 2026. This content is for informational purposes only and is not intended to provide specific financial, investment, tax, legal or accounting advice specific to any person, and should not be relied upon in that regard. Tax, investment and all other decisions should be made, as appropriate, only with guidance from a qualified professional.
© 2026 Picton Mahoney Asset Management. All rights reserved.
You may also like
-
Wealth5 months ago
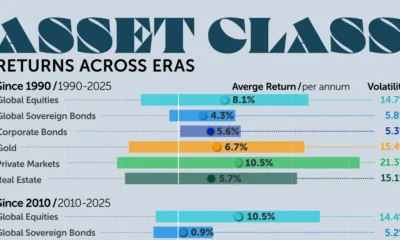
Charted: Asset Class Returns Across Eras (1990–2025)
Private markets show the highest long-term returns, while gold has been the best-performing asset since 2020.
-
Stocks2 years ago
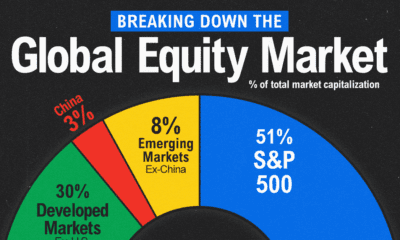
The S&P 500 Makes Up 51% of Global Stock Market Value
See a unique visual breakdown of the global equity market in this infographic.
-

Stocks2 years ago
Visualizing S&P 500 Performance by Presidential Year
We visualized historical data since November 1980 to uncover average S&P 500 performance by presidential year.
-
Investor Education2 years ago
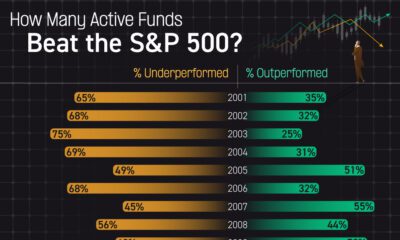
Infographic: How Many Active Funds Beat the S&P 500?
We visualized over 20 years of history to see how many active funds were able to beat the S&P 500.
-

Investor Education3 years ago
The 20 Most Common Investing Mistakes, in One Chart
Here are the most common investing mistakes to avoid, from emotionally-driven investing to paying too much in fees.
-

Stocks3 years ago
Visualizing BlackRock’s Top Equity Holdings
BlackRock is the world’s largest asset manager, with over $9 trillion in holdings. Here are the company’s top equity holdings.
Subscribe
Please enable JavaScript in your browser to complete this form.Join 375,000+ email subscribers: *Sign Up