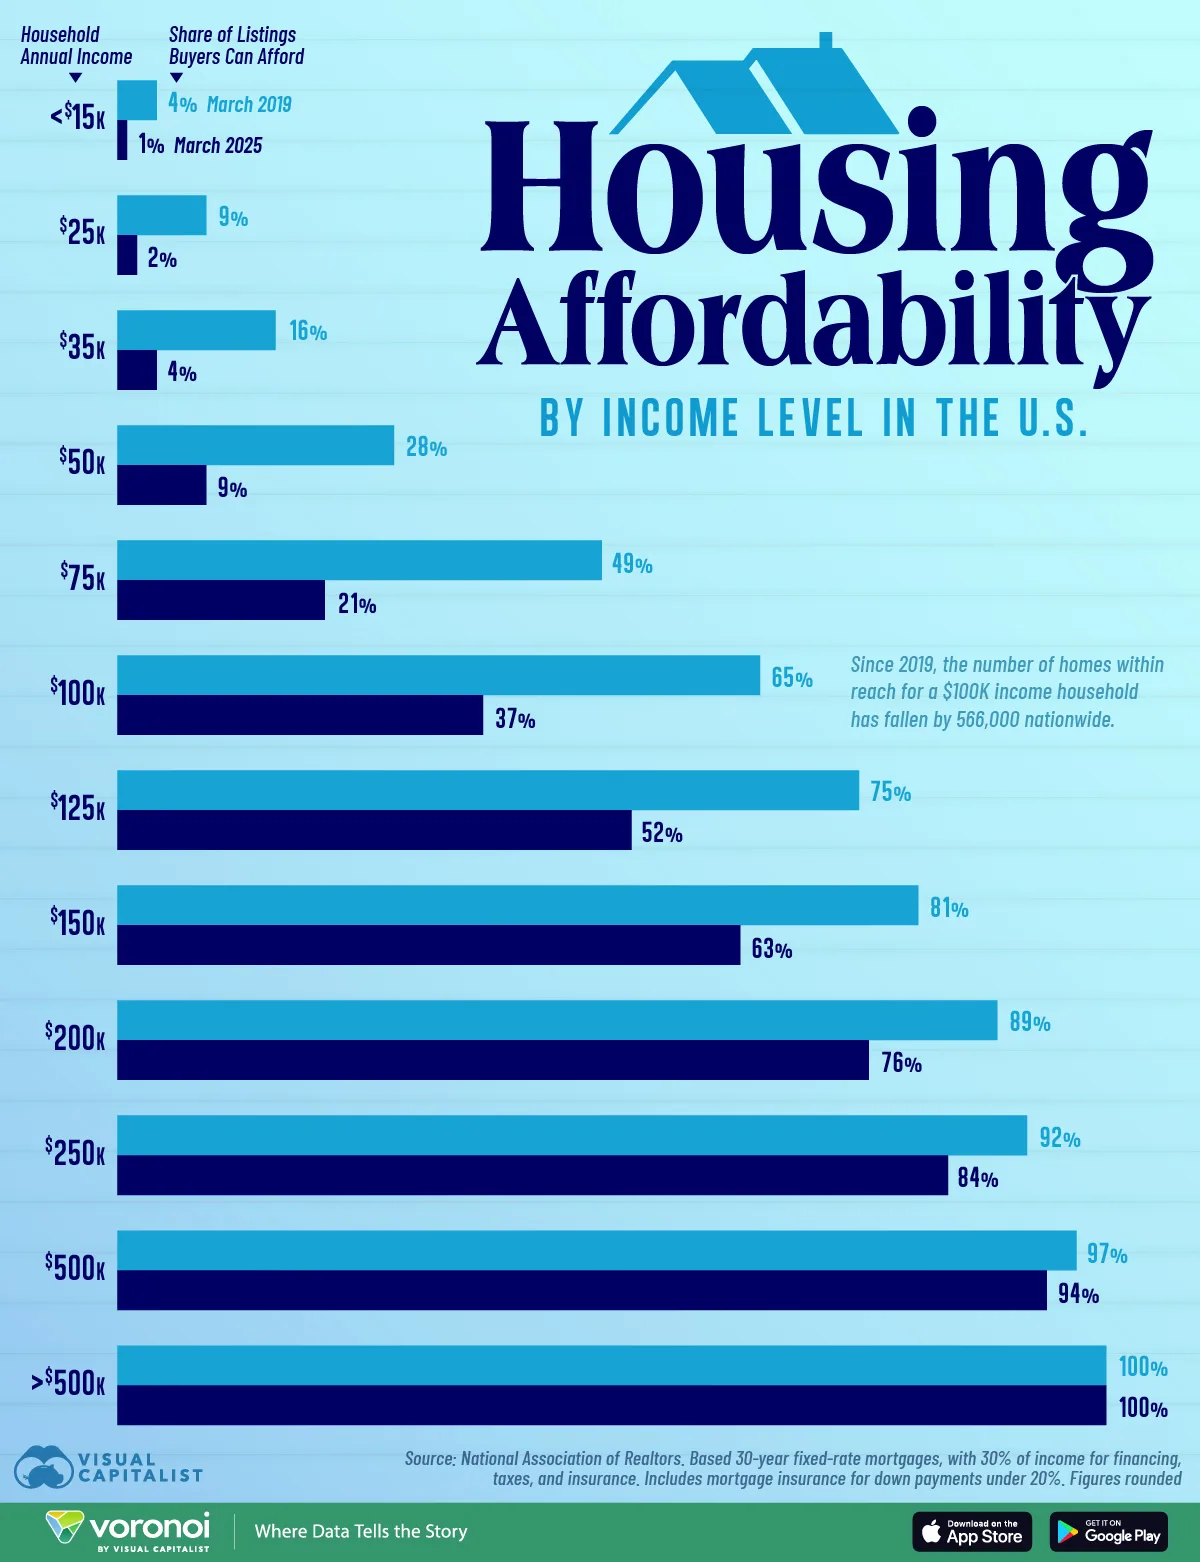
Charted: Housing Affordability in the U.S., by Income Level

See more visualizations like this on the Voronoi app.
Use This Visualization
Housing Affordability in the U.S., by Income Level (2019 vs. 2025)
31 October
Five light-hearted Halloween films, picked so the only thing that jumps out at you is a pumpkin. No gore, no jump scares — just ghosts with better comic timing than most comedies.
See more visualizations like this on the Voronoi app.
Use This Visualization
Housing Affordability in the U.S., by Income Level (2019 vs. 2025)
See more visualizations like this on the Voronoi app.
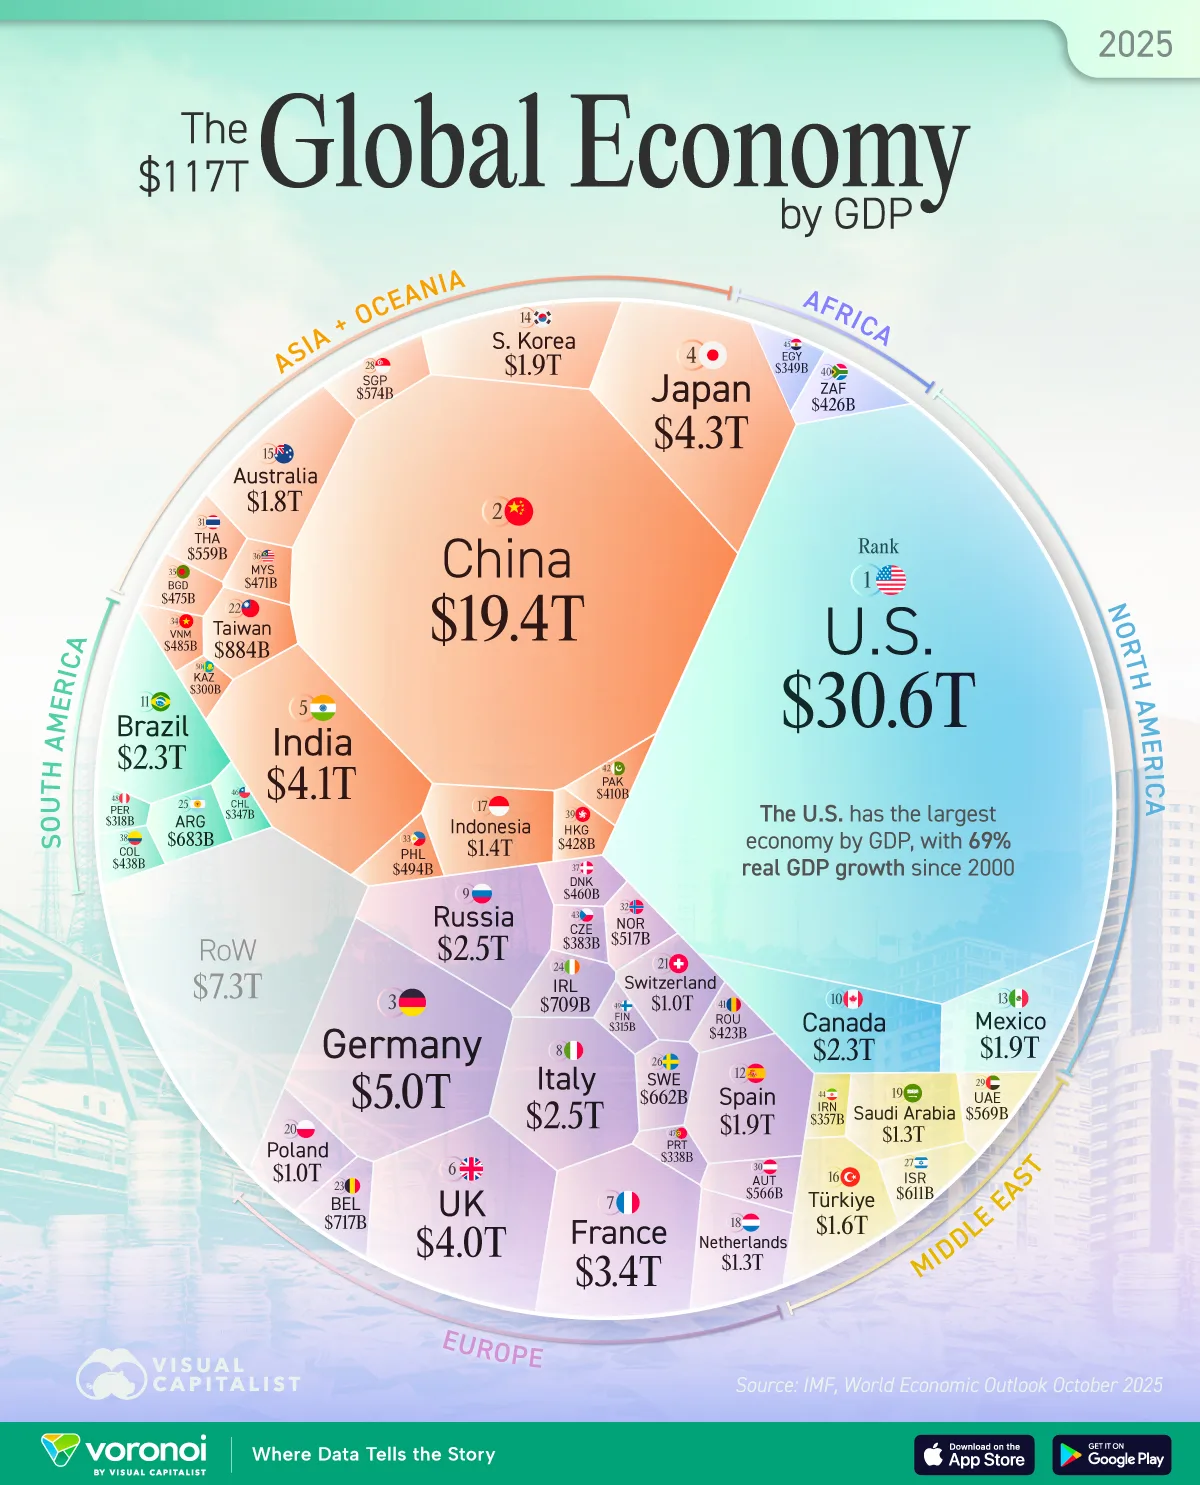
Visualizing the $117 Trillion World Economy in 2025
See visuals like this from many other data creators on our Voronoi app. Download it for free on iOS or Android and discover incredible data-driven charts from a variety of trusted sources.
Key Takeaways
See more visualizations like this on the Voronoi app.
Use This Visualization
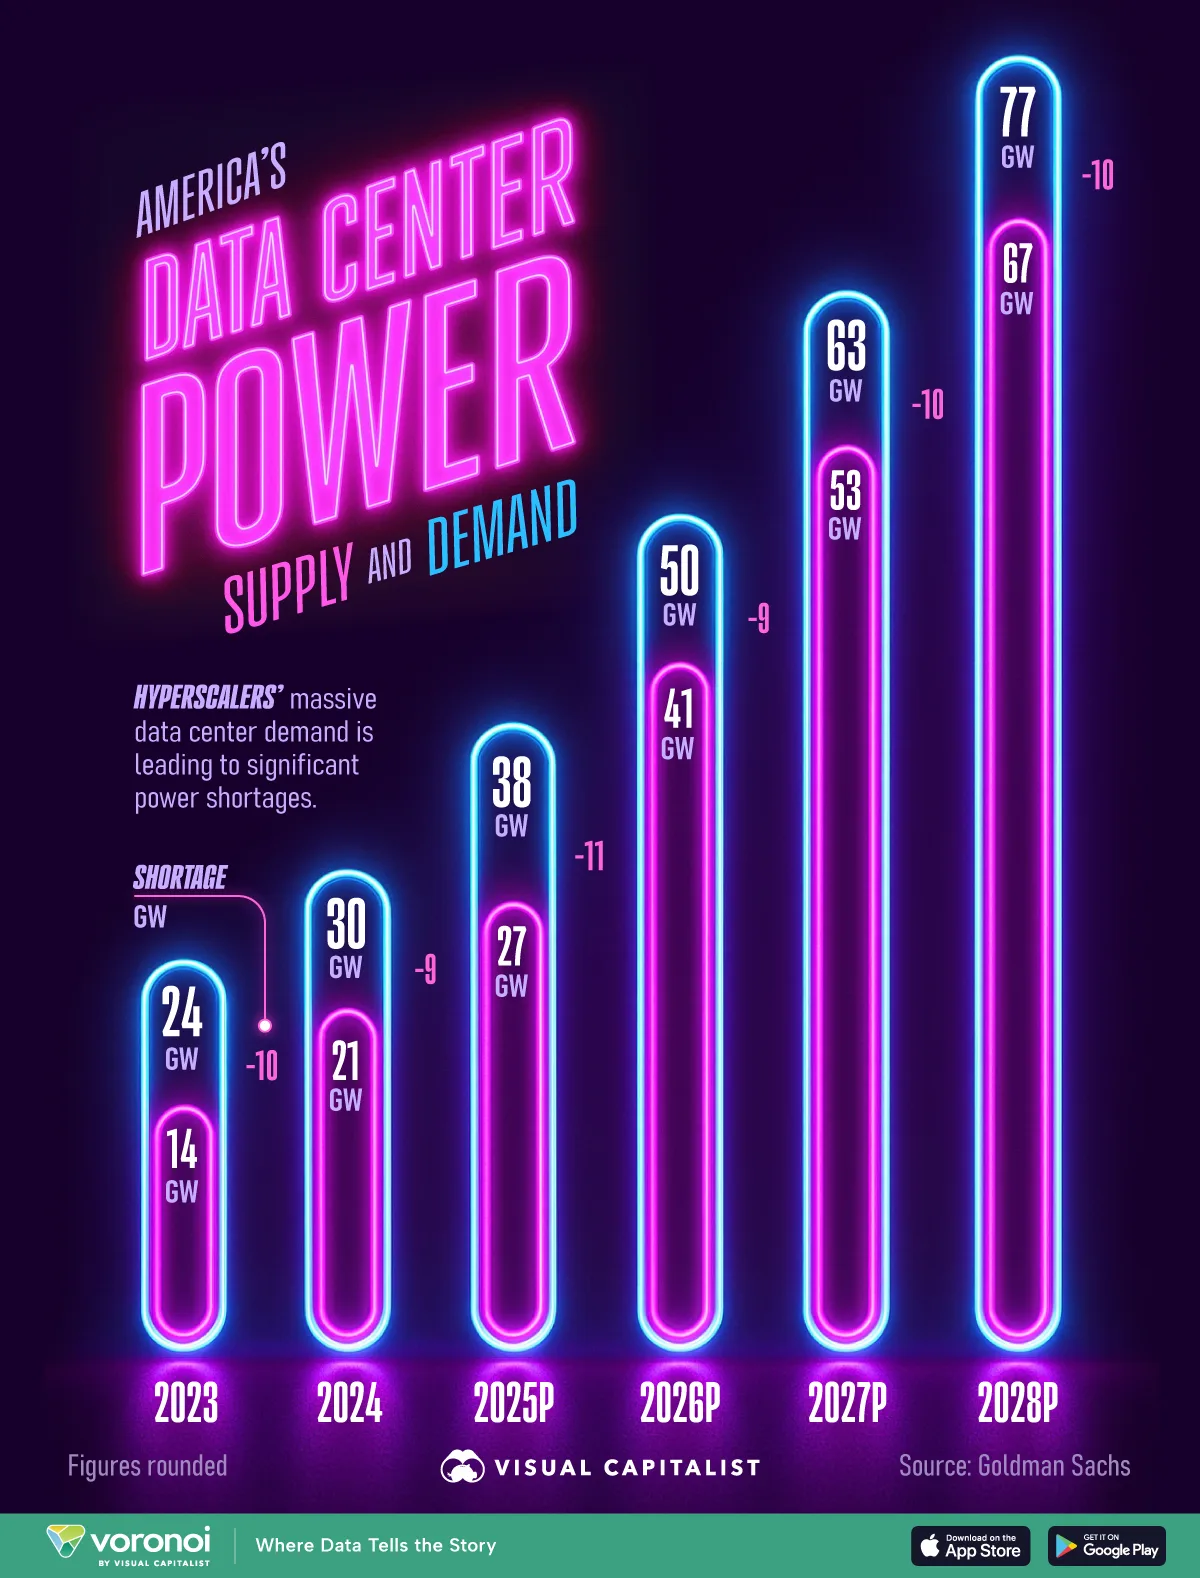
America’s Data Center Capacity Shortfall
See visuals like this from many other data creators on our Voronoi app. Download it for free on iOS or Android and discover incredible data-driven charts from a variety of trusted sources.
Key Takeaways
See more visualizations like this on the Voronoi app.
Use This Visualization
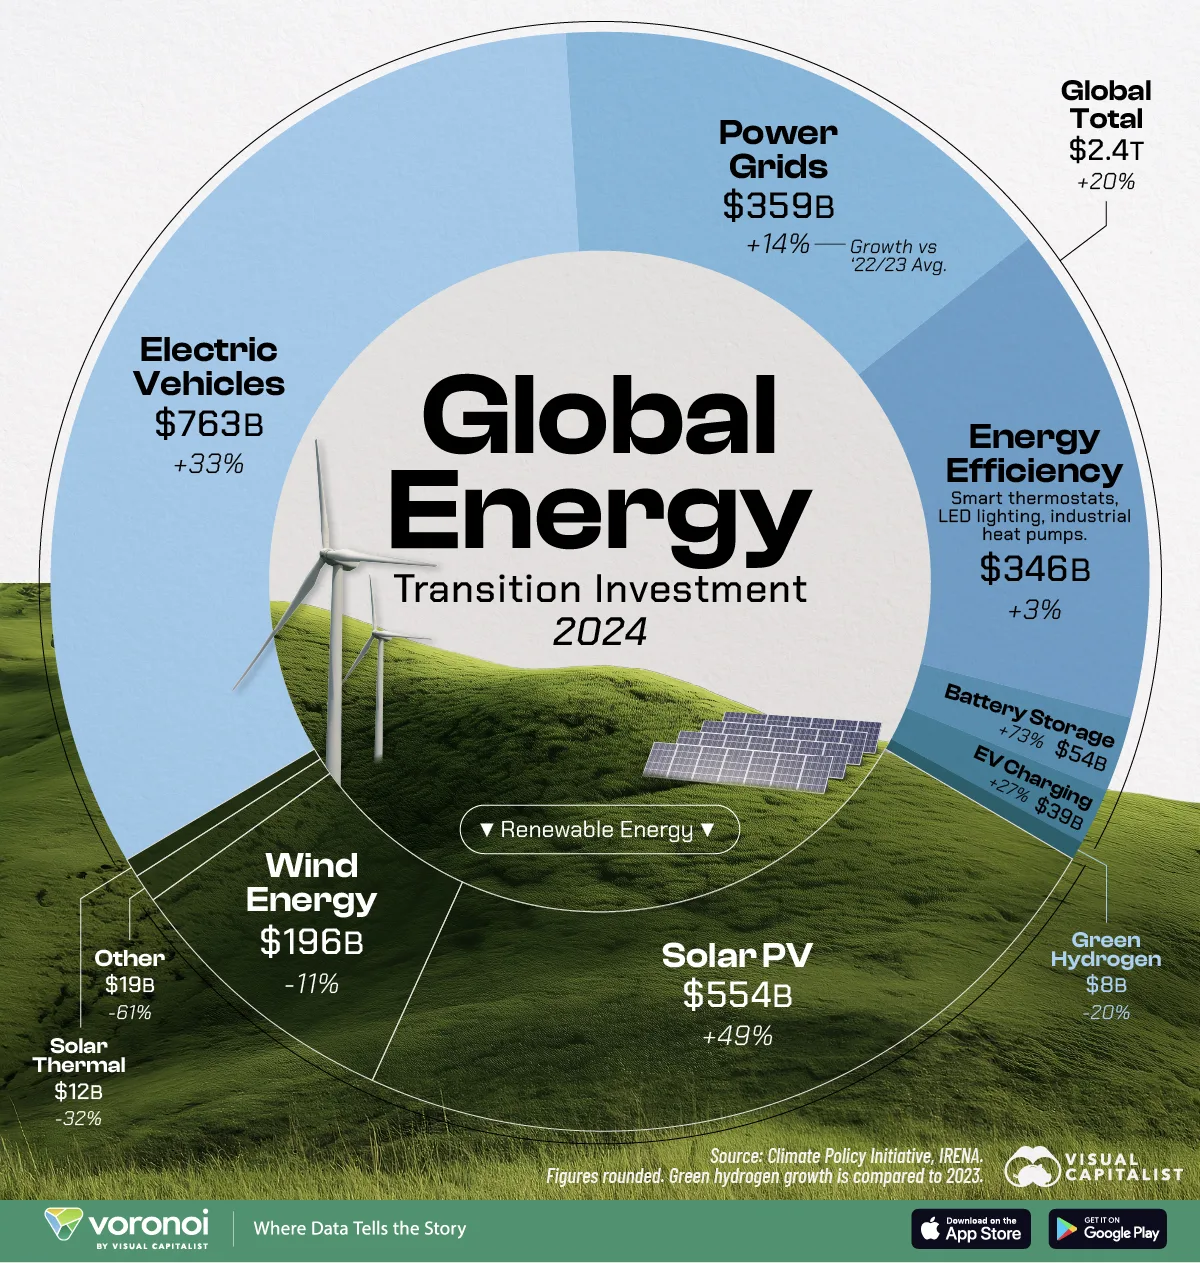
Visualizing $2.4 Trillion in Energy Transition Spending
See visuals like this from many other data creators on our Voronoi app. Download it for free on iOS or Android and discover incredible data-driven charts from a variety of trusted sources.
See more visuals like this on the Voronoi app.
Use This Visualization
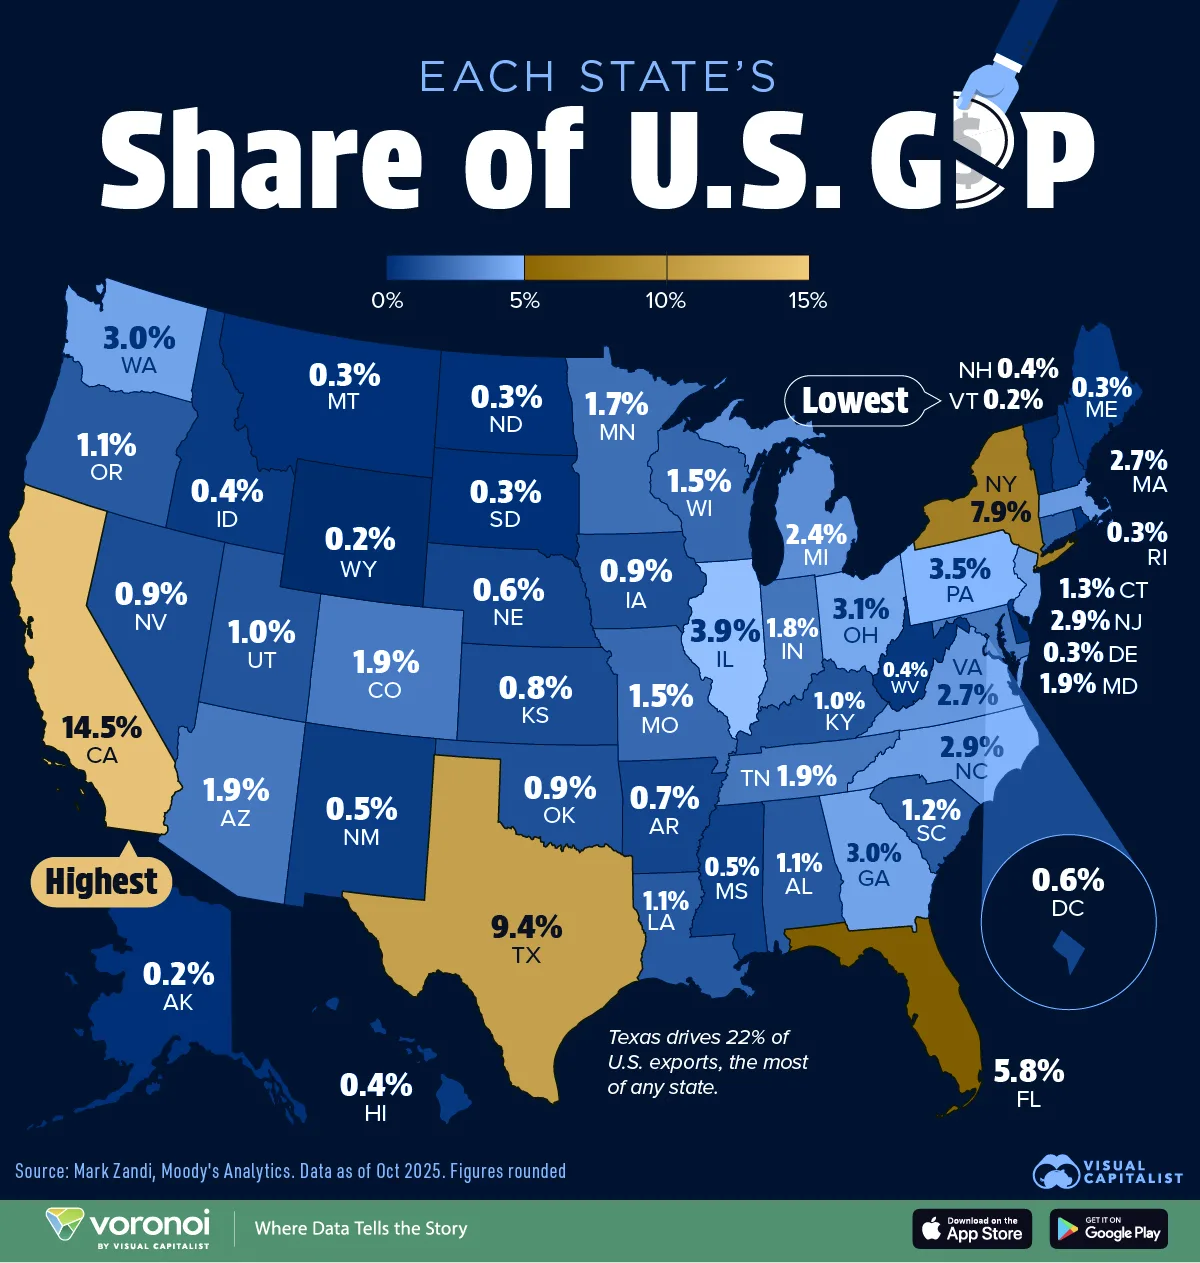
Mapped: Every State’s Share of U.S. GDP
See visuals like this from many other data creators on our Voronoi app. Download it for free on iOS or Android and discover incredible data-driven charts from a variety of trusted sources.
Key Takeaways