31 October
Halloween 5UX
Five light-hearted Halloween films, picked so the only thing that jumps out at you is a pumpkin. No gore, no jump scares — just ghosts with better comic timing than most comedies.

See more visuals like this on the Voronoi app.
Use This Visualization
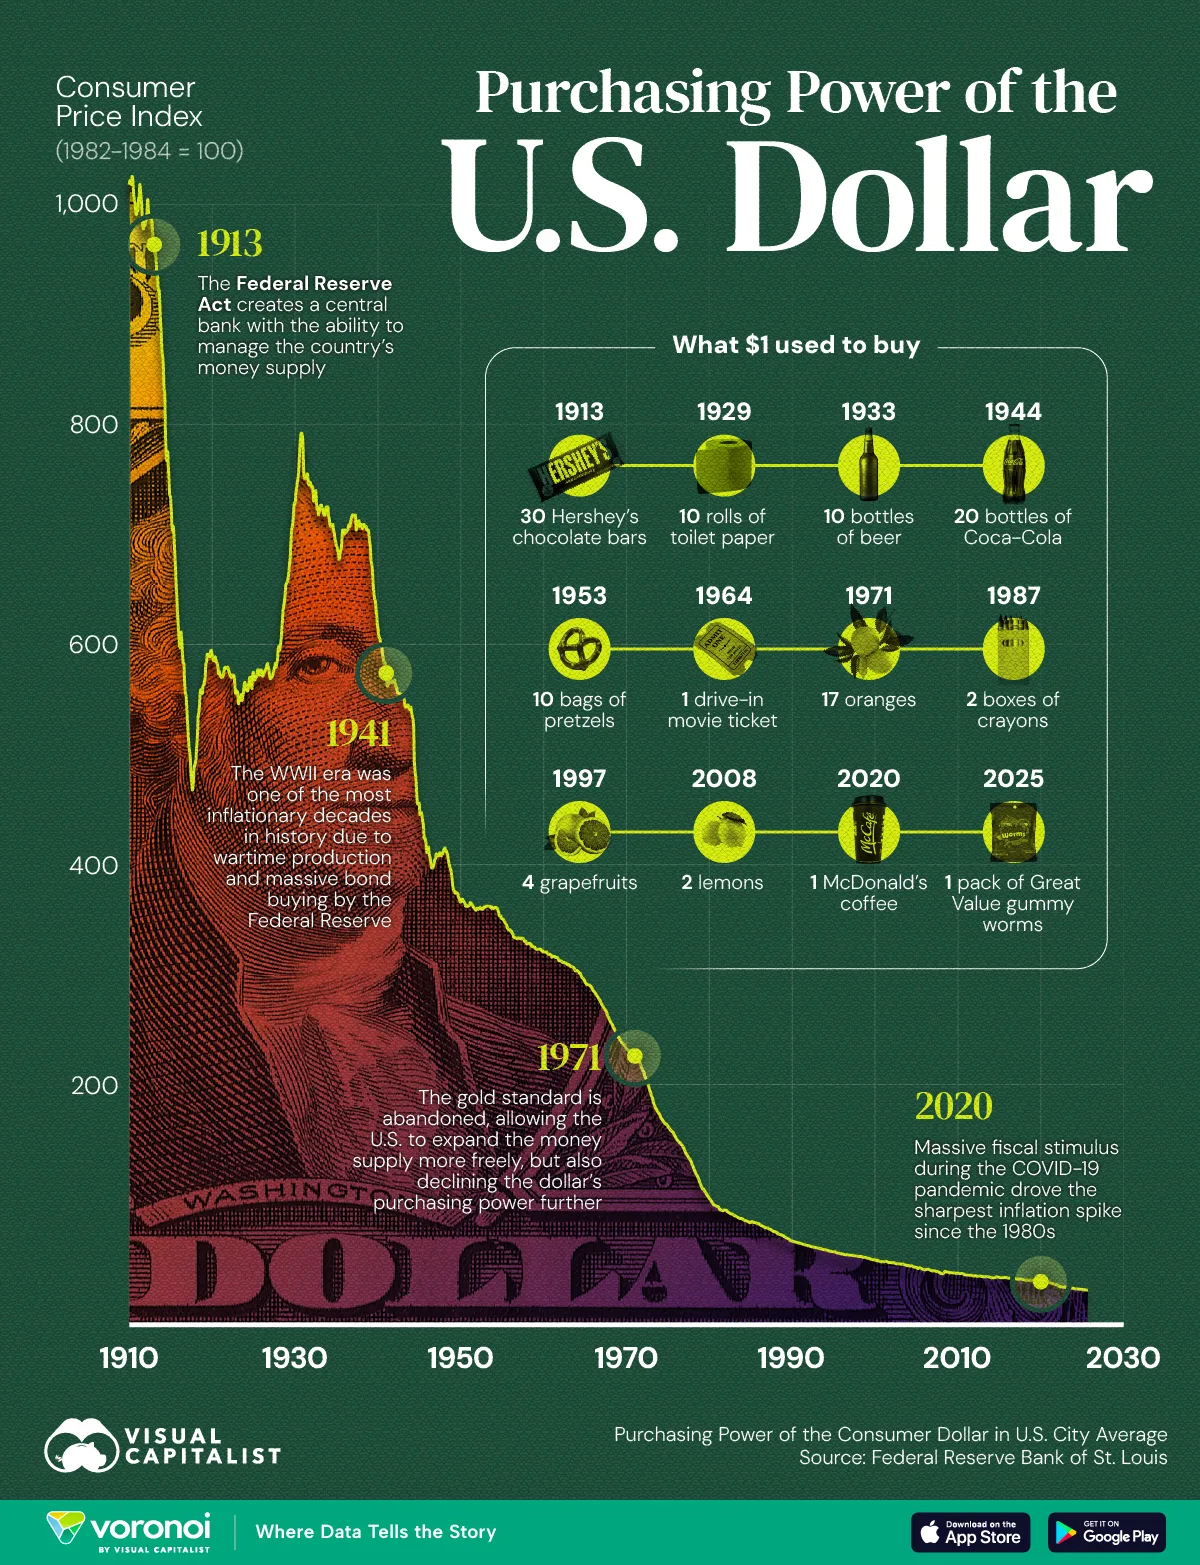
Charted: The Declining Purchasing Power of the U.S. Dollar
This was originally posted on our Voronoi app. Download the app for free on iOS or Android and discover incredible data-driven charts from a variety of trusted sources.
Key Takeaways
See more visualizations like this on the Voronoi app.

Use This Visualization
Visualized: Alcohol Consumption in the U.S. by the Numbers
See visuals like this from many other data creators on our Voronoi app. Download it for free on iOS or Android and discover incredible data-driven charts from a variety of trusted sources.
See more visualizations like this on the Voronoi app.

Countries With the Most (and Least) Incarcerated People
See visuals like this from many other data creators on our Voronoi app. Download it for free on iOS or Android and discover incredible data-driven charts from a variety of trusted sources.
Key Takeaways
See more visuals like this on the Voronoi app.
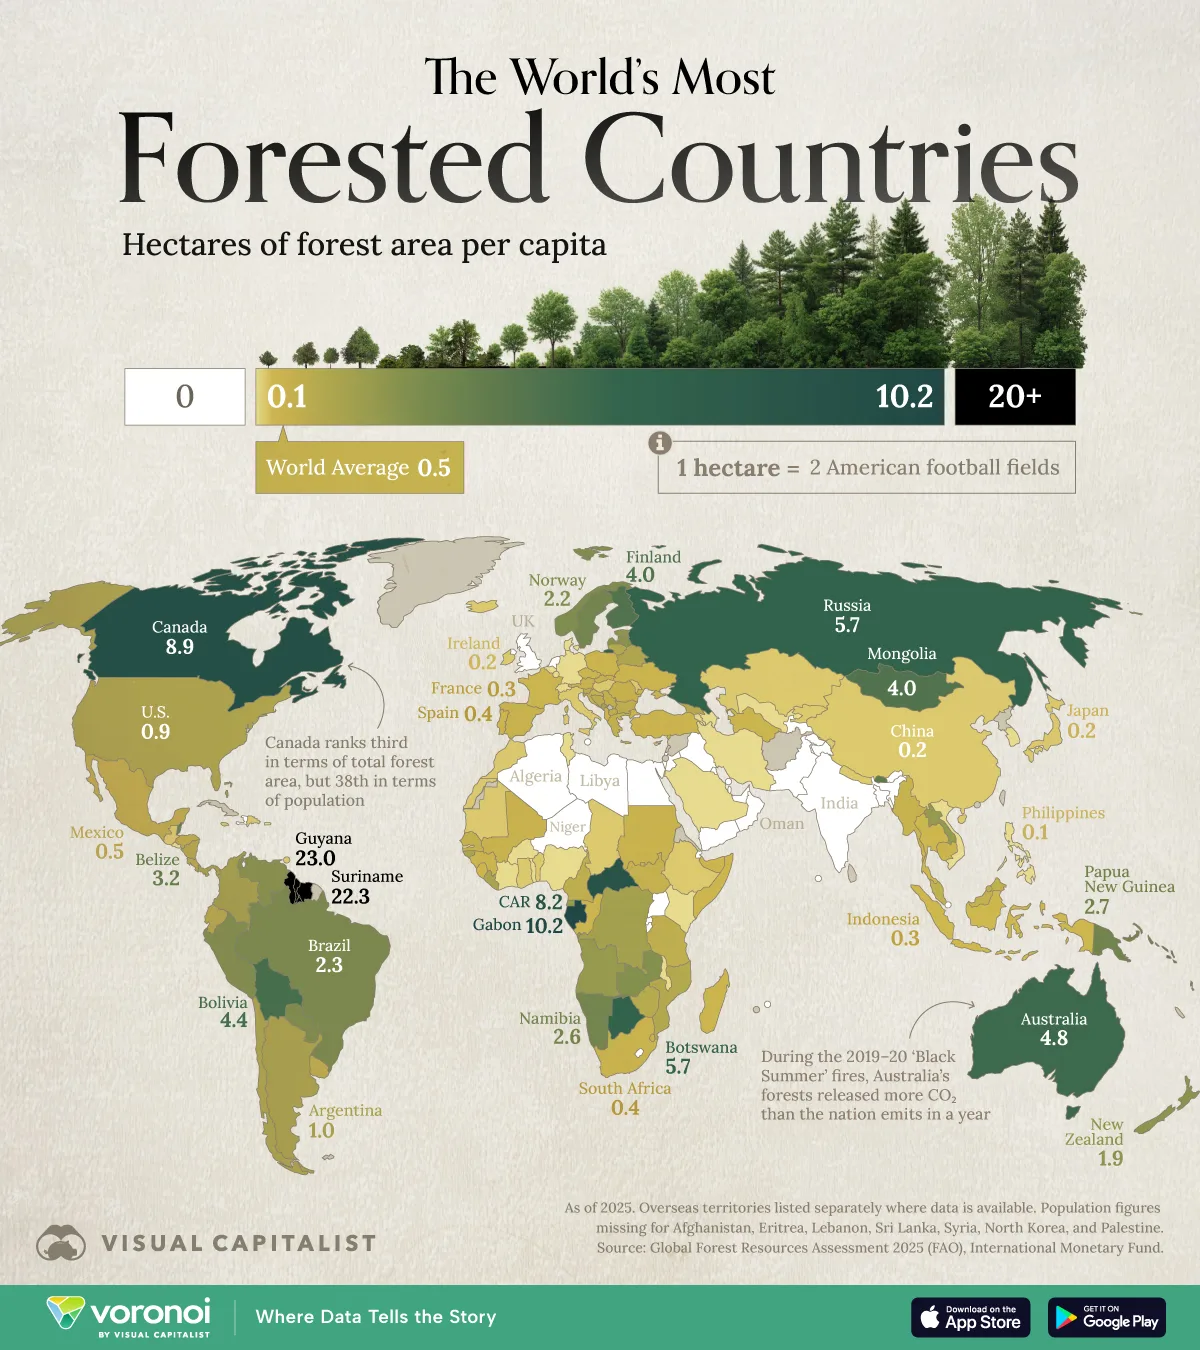
Mapped: Countries With the Most Forest Area per Capita
This was originally posted on our Voronoi app. Download the app for free on iOS or Android and discover incredible data-driven charts from a variety of trusted sources.
Key Takeaways

About 18 months ago, we launched Voronoi, our free new data discovery app.
Believe it or not, there are already more data-driven visuals on Voronoi than on Visual Capitalist (which has been around for 13 years!).
Every day there’s something new on Voronoi to see. And in aggregate, there are roughly 6,500 data stories to explore on the platform from nearly 200 world-class creators.
Explore Voronoi
Pages