The Top 10 Cleanest Operating Utilities In The U.S.
Key Takeaways
- Four of the cleanest operating utilities in the U.S. have over 80% carbon-free generation.
- PSEG leads with a 100% carbon-free fuel mix, driven by nuclear and renewables.
- Mid-ranked utilities still exceed the national average in clean energy share.
As U.S. energy providers face rising pressure to decarbonize, utilities are adopting a variety of strategies to clean up their generation portfolios. But which are the cleanest operating utilities leading the clean energy transition and which are lagging?
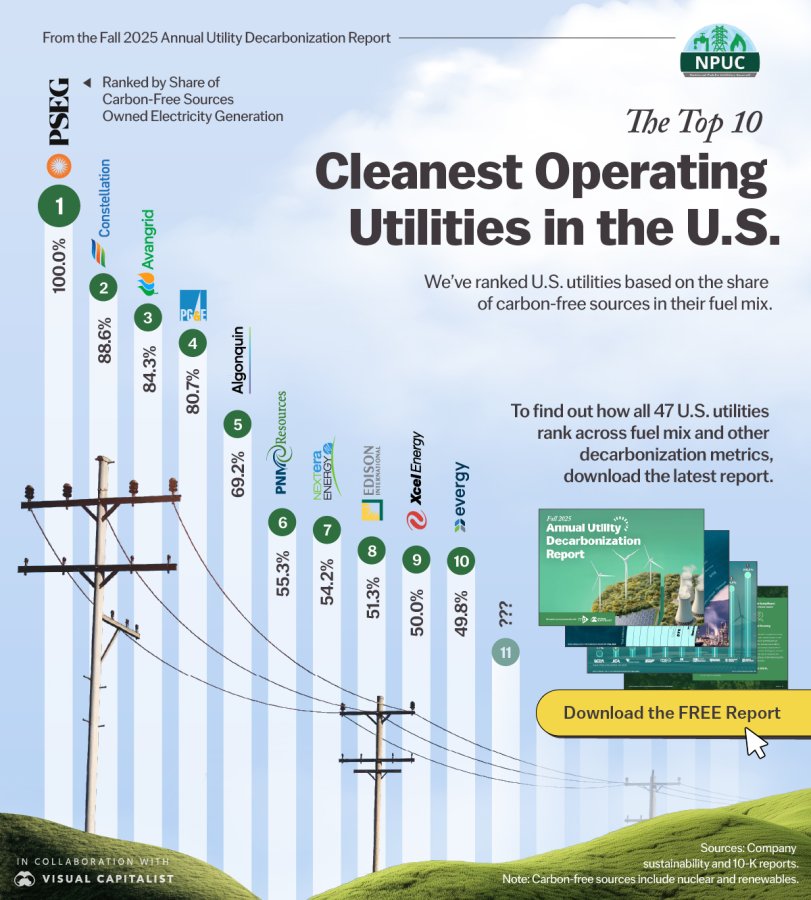
This graphic, in partnership with the National Public Utilities Council, shows the 10 cleanest-operating utilities in the U.S. by the percentage of carbon-free generation in their owned electricity mix, using data from company sustainability and 10-K reports.
Four Utilities Lead with 80%+ Carbon-Free Generation
At the top of the list is Public Service Enterprise Group (PSEG), which operates with a fully carbon-free fuel mix powered nearly exclusively by nuclear energy.
Following closely are Constellation Energy (88.57%), Avangrid (84.30%), and Pacific Gas and Electric (80.67%). These leaders leverage a mix of nuclear and renewable sources to surpass the 80% mark in carbon-free energy.
Here is a table that shows the top 10 cleanest operating utilities and their share of carbon-free electricity generation:
| Rank | Company | Fuel Mix |
|---|---|---|
| 1 | Public Service Enterprise Group | 100.00% |
| 2 | Constellation Energy | 88.57% |
| 3 | Avangrid | 84.30% |
| 4 | Pacific Gas and Electric | 80.67% |
| 5 | Algonquin Power & Utilities | 69.20% |
| 6 | PNM Resources | 55.25% |
| 7 | NextEra Energy | 54.22% |
| 8 | Edison International | 51.28% |
| 9 | Xcel Energy | 49.95% |
| 10 | Evergy | 49.80% |
A Mix of Strategies Beneath the Top Tier
Utilities ranked 5 through 10, have a wider spread of generation sources using more carbon emitting fuels. Though below the 80% threshold, they still achieve between 49% and 69% carbon-free generation, well above many industry peers.
These firms are in different stages of the transition, often balancing legacy fossil fuel assets with new clean energy investments. Strategic shifts, regulatory environments, and capital availability all shape their pace of decarbonization.
Explore the Full Rankings
To find out how all 47 U.S. utilities rank across fuel mix and other decarbonization metrics, download the latest National Public Utilities Council report.
As the clean energy transition accelerates, benchmarking progress across the sector is more critical than ever.
Source: Company sustainability and 10-K reports. (July 2025)