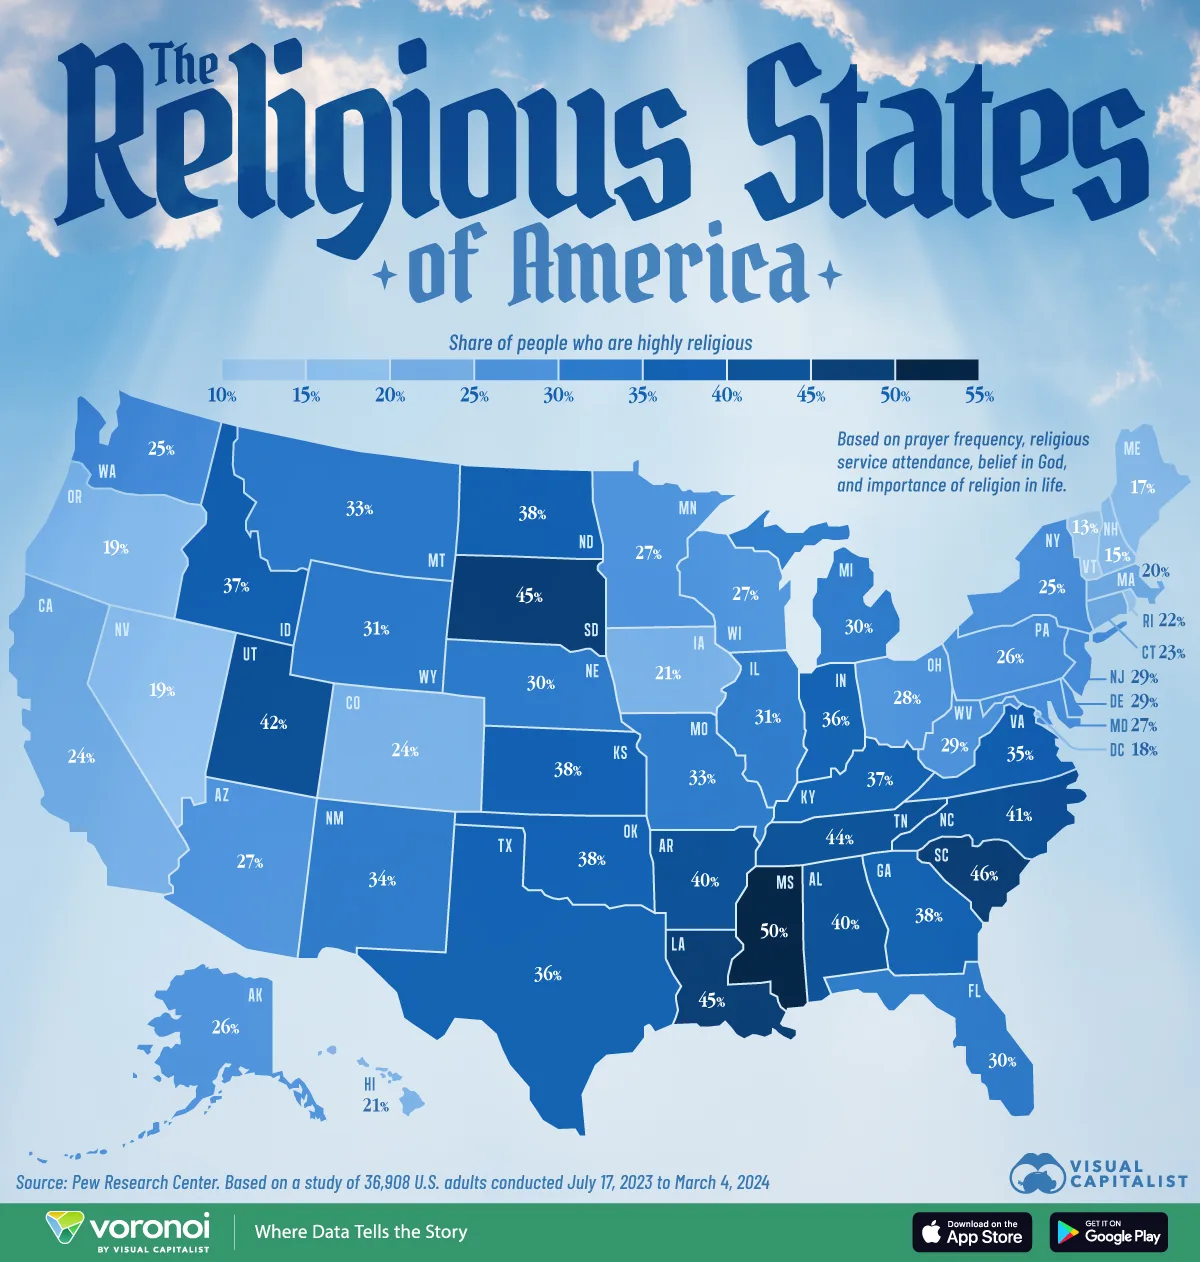
Mapped: The Most Religious States in America
![]()
See more visualizations like this on the Voronoi app.

Use This Visualization
Mapped: The Most Religious States in America
See visuals like this from many other data creators on our Voronoi app. Download it for free on iOS or Android and discover incredible data-driven charts from a variety of trusted sources.
Key Takeaways
Mapped: Countries That Eat the Most Meat Per Capita
Ranked: The World’s 30 Most Powerful Rivers
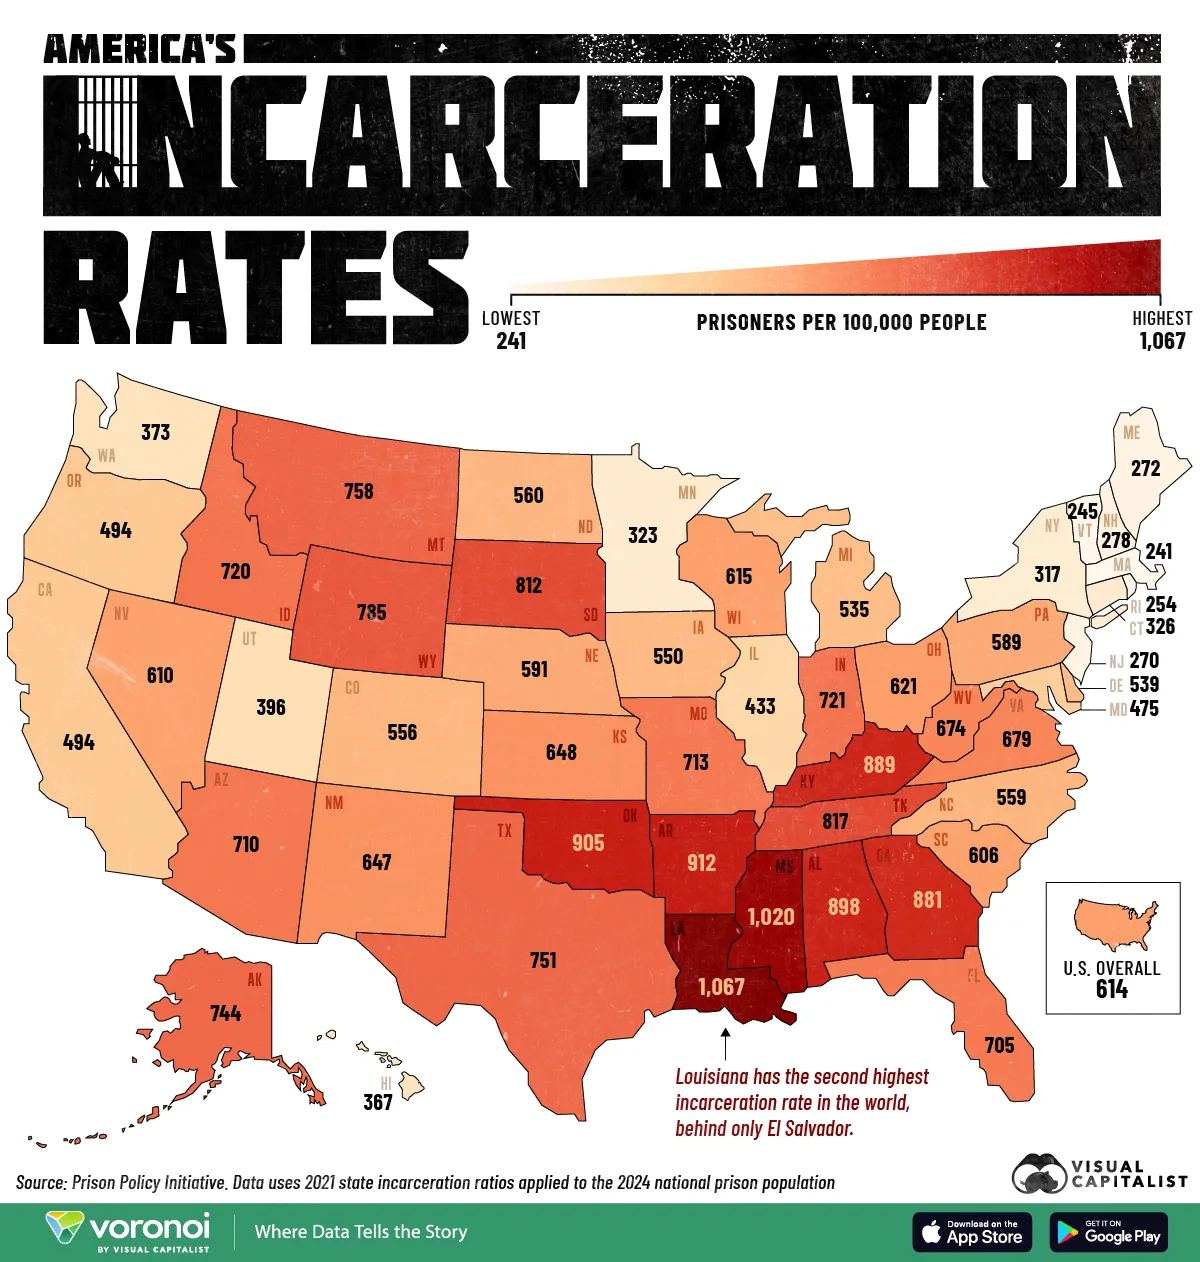
Mapped: U.S. Incarceration Rates by State
![]()
See more visualizations like this on the Voronoi app.

Use This Visualization
Mapped: U.S. Incarceration Rates by State
See visuals like this from many other data creators on our Voronoi app. Download it for free on iOS or Android and discover incredible data-driven charts from a variety of trusted sources.
Key Takeaways