You are here

Bureau of Labor Statistics

Charted: Four Decades of U.S. Inflation

Charted: Four Decades of U.S. Inflation

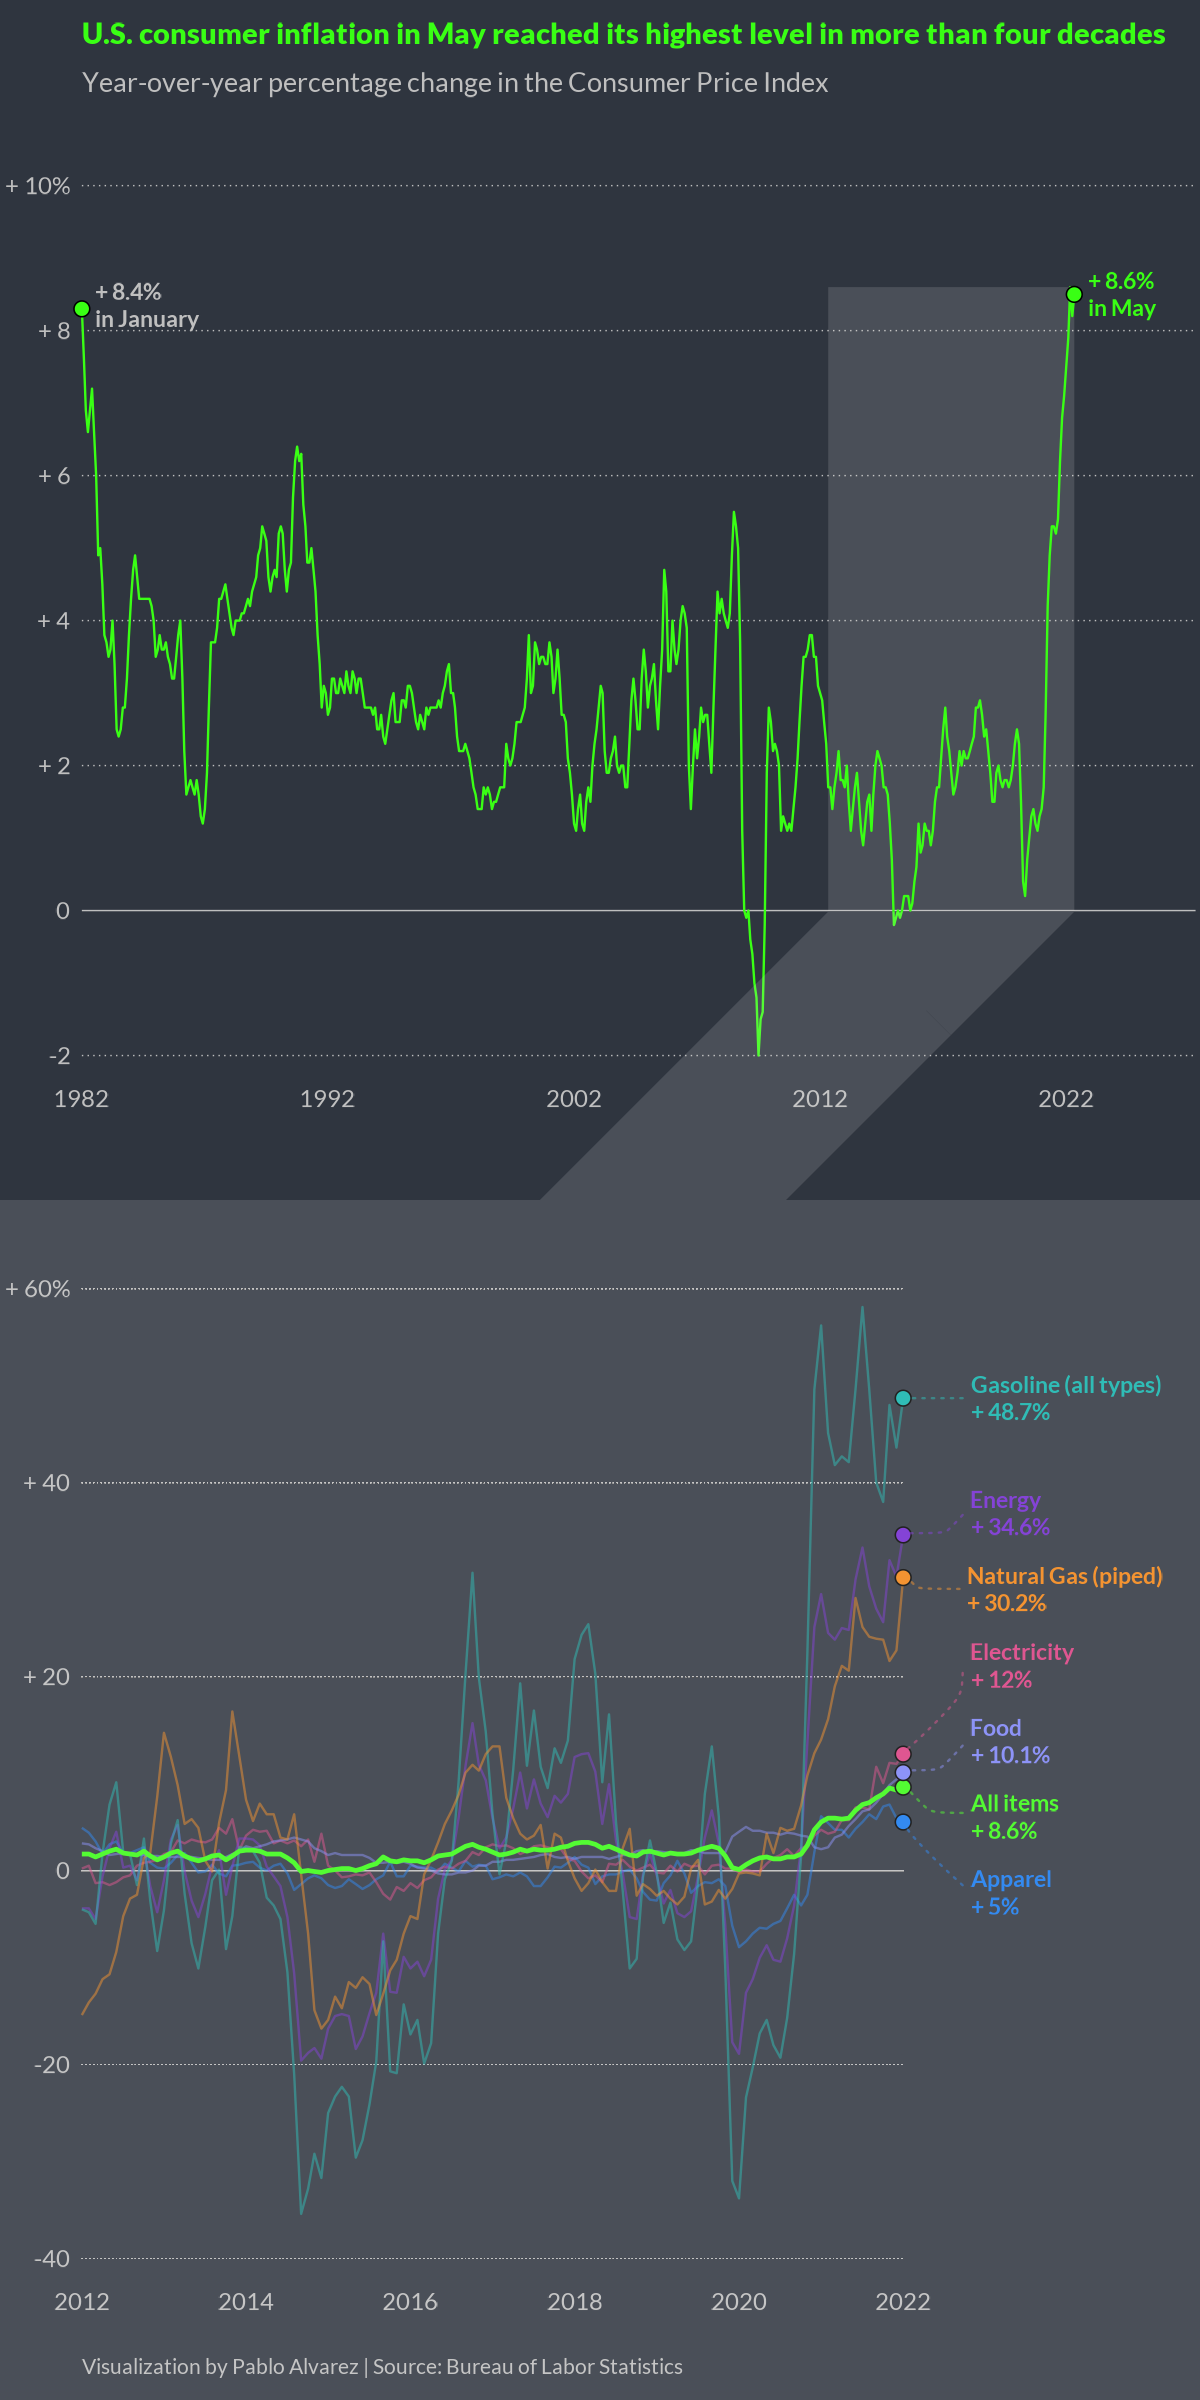
In May 2022, the annual rate of U.S. inflation grew to 8.6%—the highest it’s been in four decades, according to the Bureau of Labor Statistics.

What’s driving this surge, and what products are seeing the most significant price jumps?

This visualization by Pablo Alvarez shows U.S. inflation levels since 1982 and highlights a few product categories that have seen the biggest year-over-year increases.

93% Of All Jobs "Created" Since 2008 Were Added Through The Birth/Death Model

93% Of All Jobs "Created" Since 2008 Were Added Through The Birth/Death Model

According to the prevailing narrative, job growth in the US, where GDP over the past decade has been on par with that in the 1930s, is one of the otherwise brighter economic indicators in a time when much of the economic data such as capital spending, productivity and especially wage growth (so critical for the Fed's future plans) has been a chronic disappointment. Today, for example, headlines blast that the US has enjoyed 80 months of continuous jobs growth with unemployment hitting 4.3% – the lowest since 2001.

Pages