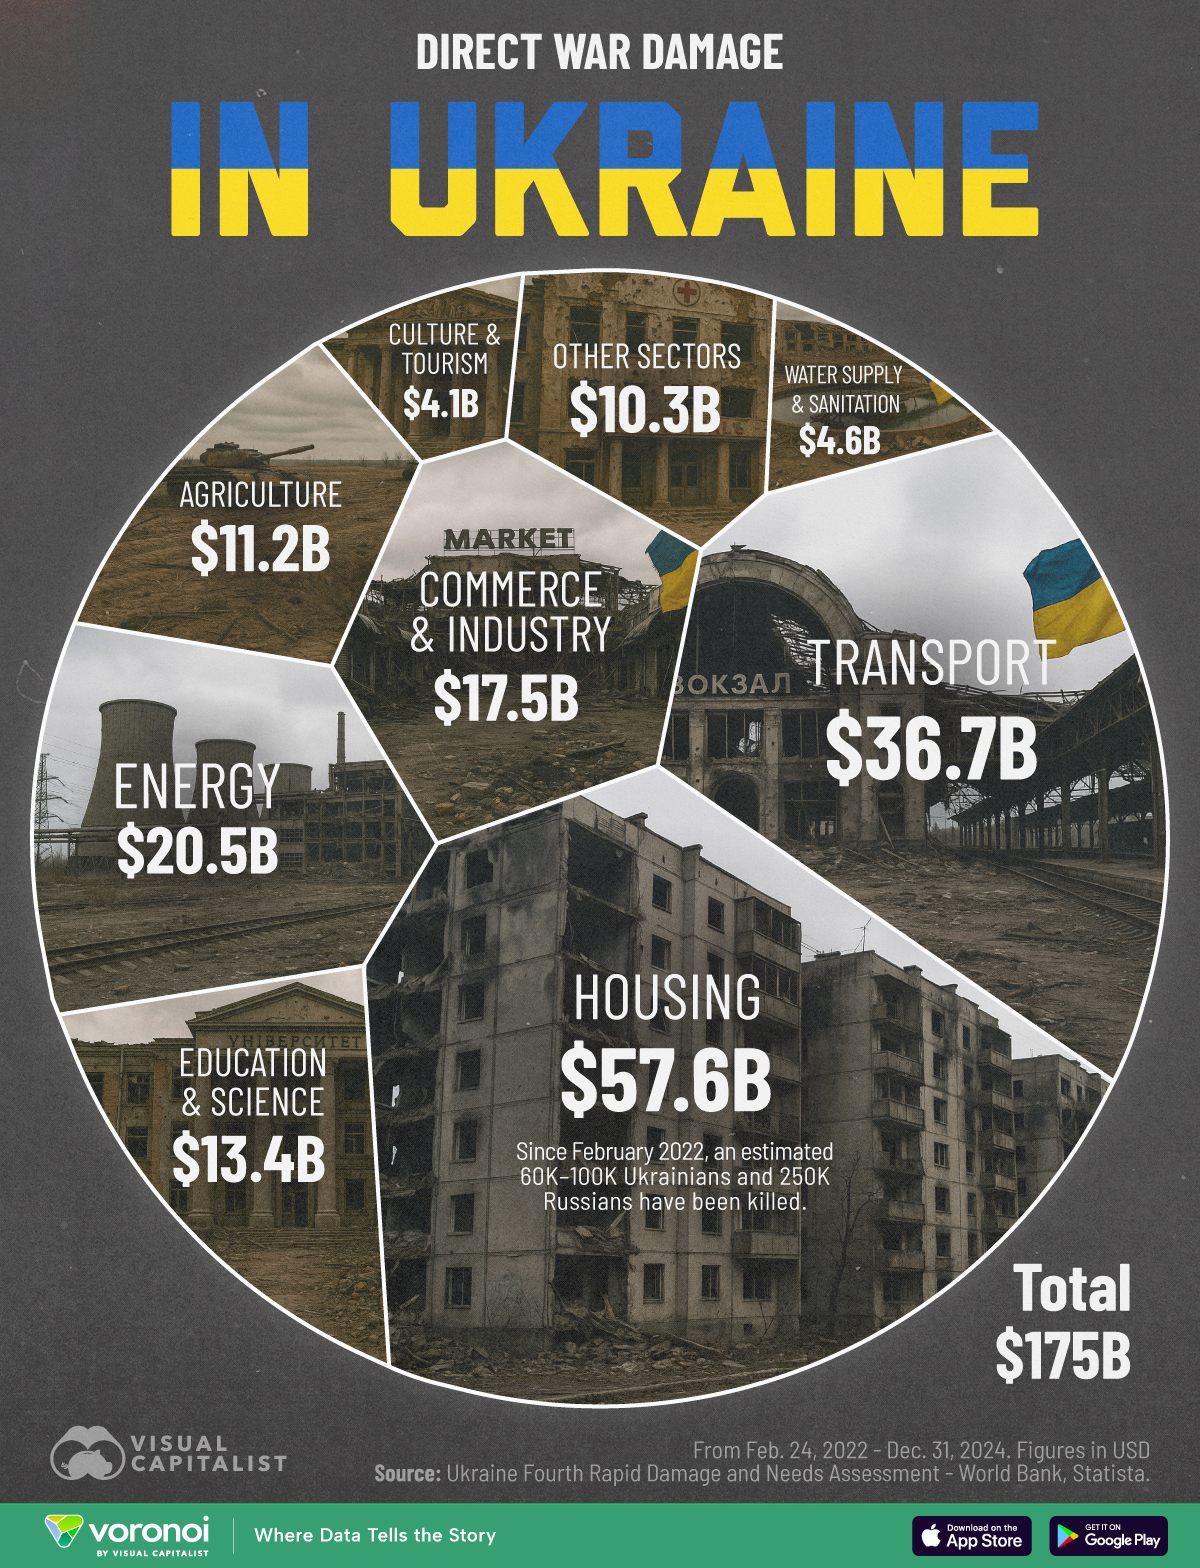
You are here

Environment

Interactive Map: U.S. Property Taxes by State

http://datawrapper.dwcdn.net/wACf1/3/!function(){"use strict";window.addEventListener("message",(function(a){if(void 0!==a.data["datawrapper-height"]){var e=document.querySelectorAll("iframe");for(var t in a.data["datawrapper-height"])for(var r=0;r

Mapped: U.S. Property Taxes by State

Almost $600 billion in revenue was generated from U.S. state and local property tax revenue in 2020, a figure that has gradually risen over the last several decades.

Charted: Global CO2 Emissions by Income Group

Global CO2 Emissions by Income Group

From a historical perspective, the current demand for natural resources has surged to unprecedented levels and continues to escalate—for both essential needs like food, clothing, water, housing, infrastructure, and non-essential consumption in everyday life.

This surge has been accompanied by annual increases in CO₂ emissions. Consumption, however, differs radically depending on income.

Visualized: Global CO2 Emissions Through Time (1950–2022)

Subscribe to the Decarbonization Channel’s free mailing list for more like this

Visualized: Global CO2 Emissions Through Time (1950-2022)

This was originally posted on the Decarbonization Channel. Subscribe to the free mailing list to be the first to see graphics related to decarbonization with a focus on the U.S. energy sector.

Global CO2 emissions have grown six-fold since 1950.

Pages