You are here

North America

Visualizing Trade: The 2023 Creator Program Challenge Shortlist

What can you visualize when it comes to ‘International Trade’? That was the assignment given for the first ever Creator Program Challenge.

The challenge was part of the Visual Capitalist Creator Program, established in 2022 to showcase the world’s best data storytellers in one place. Creators from around the world were tasked with creating a mobile-optimized data visualization on international trade.
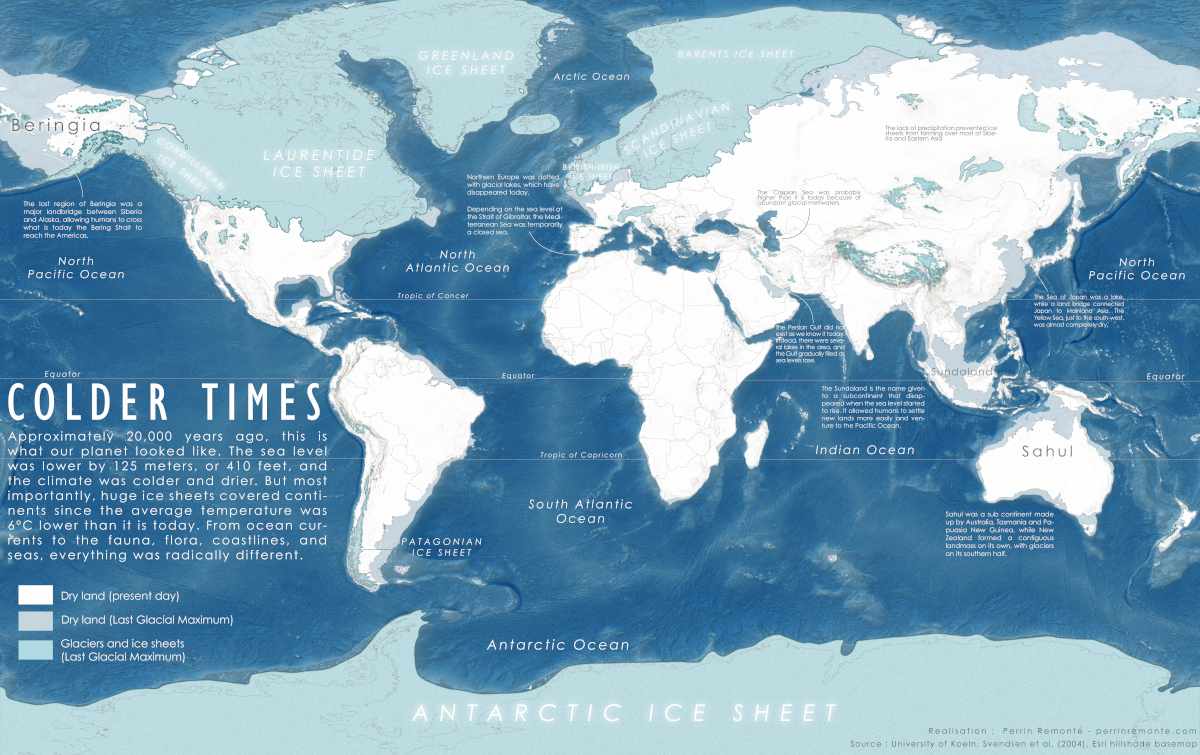
Mapped: What Did the World Look Like in the Last Ice Age?

Click to view this graphic in a higher-resolution.

What Did the World Look Like in the Last Ice Age?

What did the world look like during the last ice age? Was it all endless glaciers and frozen ice? The answer is a partial yes—with some interesting caveats.

The Last Glacial Maximum (LGM), colloquially called the last ice age, was a period in Earth’s history that occurred roughly 26,000 to 19,000 years ago.

Pages