Trump vs. Biden: ICE Detentions by Administration (2019-2025)
![]()
See this visualization first on the Voronoi app.
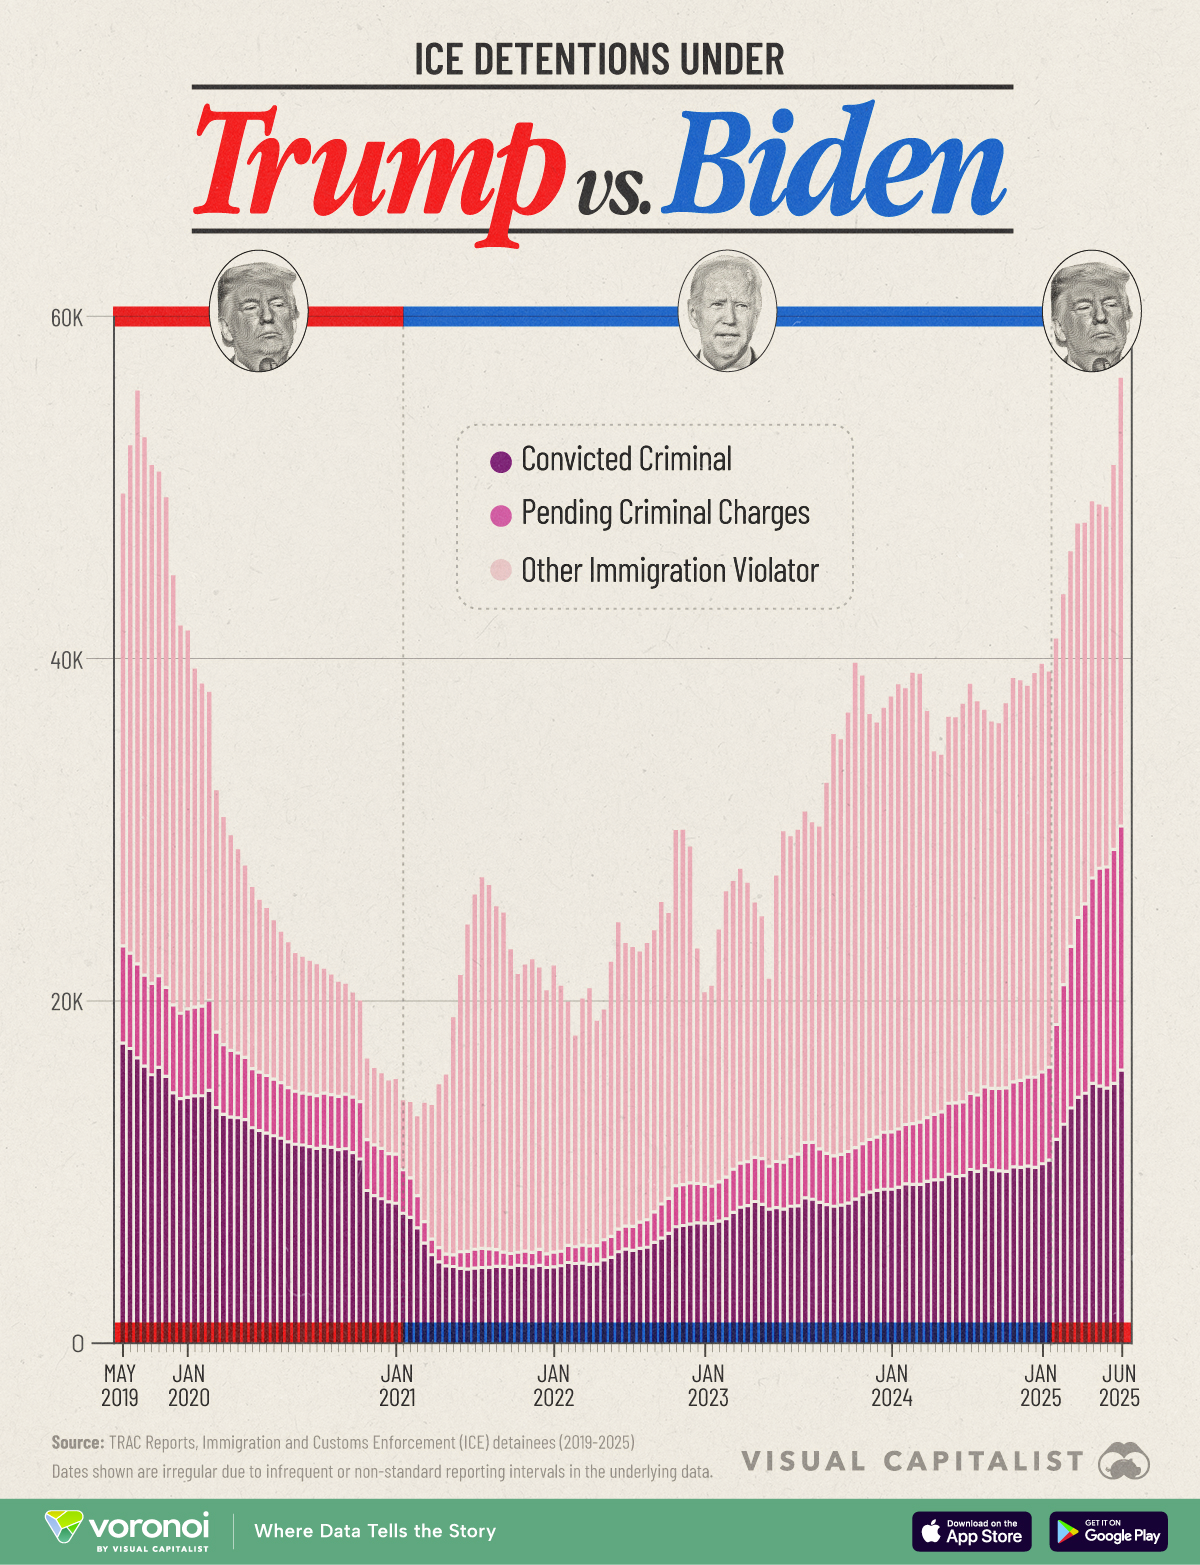
Use This Visualization
ICE Detentions More Than Double: Trump vs. Biden Comparison
This was originally posted on our Voronoi app. Download the app for free on iOS or Android and discover incredible data-driven charts from a variety of trusted sources.