Mapped: The 10 U.S. States With the Highest Cost of Living
![]()
See this visualization first on the Voronoi app.
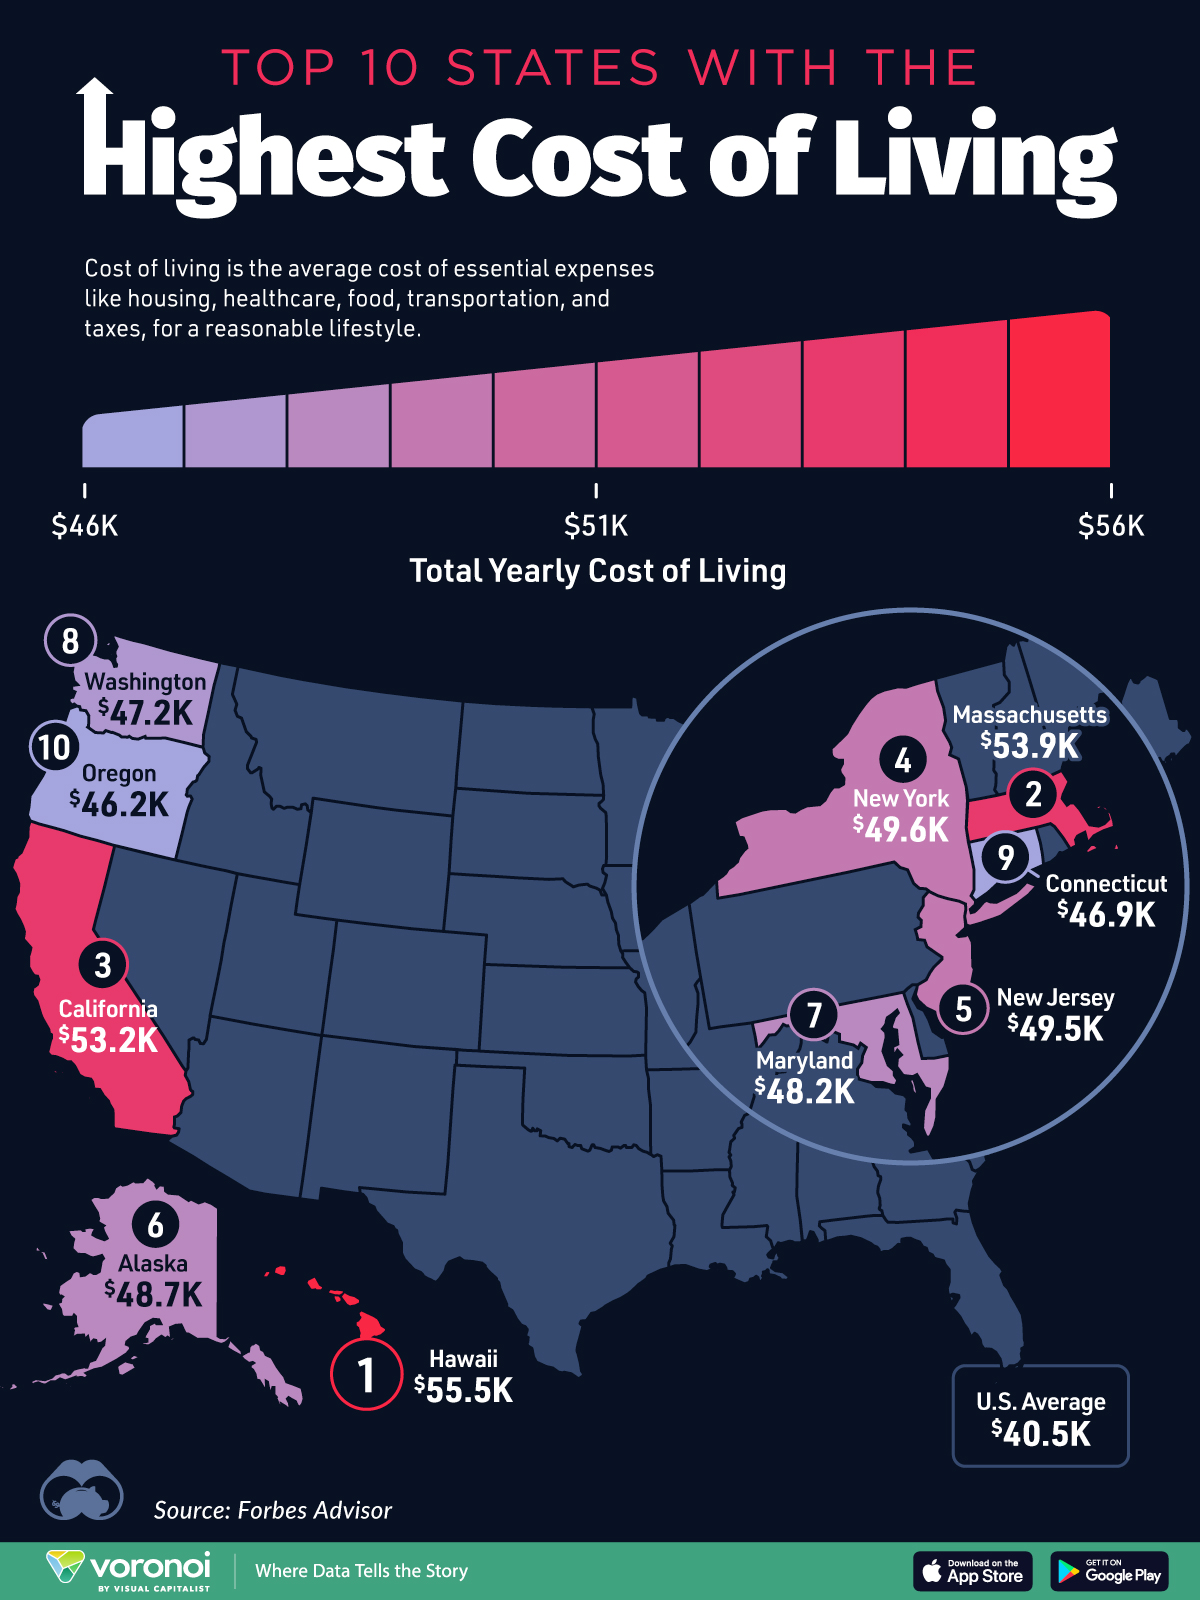
The 10 U.S. States With the Highest Cost of Living
This was originally posted on our Voronoi app. Download the app for free on iOS or Android and discover incredible data-driven charts from a variety of trusted sources.
Ever wondered where your dollar stretches the least in the U.S.?